Search icon CANCEL
Subscription
0
Cart icon
Cart
Close icon
You have no products in your basket yet
Save more on your purchases!
Savings automatically calculated. No voucher code required
Arrow left icon
All Products
Best Sellers
New Releases
Books
Videos
Audiobooks
Learning Hub
Newsletters
Free Learning
Arrow right icon
zł39.99 | ALL EBOOKS & VIDEOS
Save more on purchases! Buy 2 and save 10%, Buy 3 and save 15%, Buy 5 and save 20%
Effective Amazon Machine Learning

Effective Amazon Machine Learning: Expert web services for machine learning on cloud

By Alexis Perrier
zł177.99 zł39.99
Book Apr 2017 306 pages 1st Edition
eBook
zł177.99 zł39.99
Print
zł221.99
Subscription
Free Trial
eBook
zł177.99 zł39.99
Print
zł221.99
Subscription
Free Trial

What do you get with eBook?

Product feature icon Instant access to your Digital eBook purchase
Product feature icon Download this book in EPUB and PDF formats
Product feature icon Access this title in our online reader with advanced features
Product feature icon DRM FREE - Read whenever, wherever and however you want
Buy Now
Table of content icon View table of contents Preview book icon Preview Book

Effective Amazon Machine Learning

Chapter 1. Introduction to Machine Learning and Predictive Analytics

As artificial intelligence and big data have become a ubiquitous part of our everyday lives, cloud-based machine learning services are part of a rising billion-dollar industry. Among the several services currently available on the market, Amazon Machine Learning stands out for its simplicity. Amazon Machine Learning was launched in April 2015 with a clear goal of lowering the barrier to predictive analytics by offering a service accessible to companies without the need for highly skilled technical resources.

This introductory chapter is a general presentation of the Amazon Machine Learning service and the types of predictive analytics problems it can solve. The Amazon Machine Learning platform distinguishes itself by its simplicity and straightforwardness. However, simplicity often implies that hard choices have been made. We explain what was sacrificed, why these choices make sense, and how the resulting simplicity can be extended with other services in the rich data-focused AWS ecosystem.

We explore what types of predictive analytics projects the Amazon Machine Learning platform can address and how it uses a simple linear model for regression and classification problems. Before starting a predictive analytics project, it is important to understand what context is appropriate and what constitutes good results. We present the context for successful predictions with Amazon Machine Learning (Amazon ML).

The reader will understand what sort of problems Amazon ML can address and the assumptions with regard to the underlying data. We show how Amazon ML solves linear regression and classification problems with a simple linear model and why that makes sense. Finally, we present the limitations of the platform.

This chapter addresses the following topics:

  • What is Machine Learning as a Service (MLaaS) and why does it matter?
  • How Amazon ML successfully leverages linear regression, a simple and powerful model
  • What is predictive analytics and what types of regression and classification problems can it address?
  • The necessary conditions the data must verify to obtain reliable predictions
  • What's missing from the Amazon ML service?

Introducing Amazon Machine Learning


In the emerging MLaaS industry, Amazon ML stands out on several fronts. Its simplicity, allied to the power of the AWS ecosystem, lowers barriers to entry in machine learning for companies while balancing out performances and costs.

Machine Learning as a Service

Amazon Machine Learning is an online service by Amazon Web Services (AWS) that does supervised learning for predictive analytics.

Launched in April 2015 at the AWS summit, Amazon ML joins a growing list of cloud-based machine learning services, such as Microsoft Azure, Google prediction, IBM Watson, Prediction IO, BigML, and many others. These online machine learning services form an offer commonly referred to as Machine Learning as a Service or MLaaS following a similar denomination pattern of other cloud-based services such as SaaS, PaaS, and IaaS respectively for Software, Platform, or Infrastructure as a Service.

Studies show that MLaaS is a potentially big business trend. ABI research, a business intelligence consultancy, estimates machine learning-based data analytics tools and services revenues to hit nearly $20 billion in 2021 as MLaaS services take off as outlined in this business report: http://iotbusinessnews.com/2016/08/01/39715-machine-learning-iot-enterprises-spikes-advent-machine-learning-service-models/

Eugenio Pasqua, Research Analyst at ABI Research, said the following:

"The emergence of the Machine-Learning-as-a-Service (MLaaS) model is good news for the market, as it cuts down the complexity and time required to implement machine learning and thus opens the doors to an increase in its adoption level, especially in the small-to-medium business sector."

The increased accessibility is a direct result of using an API-based infrastructure to build machine-learning models instead of developing applications from scratch. Offering efficient predictive analytics models without the need to code, host, and maintain complex code bases lowers the bar and makes ML available to smaller businesses and institutions.

Amazon ML takes this democratization approach further than the other actors in the field by significantly simplifying the predictive analytics process and its implementation. This simplification revolves around four design decisions that are embedded in the platform:

  • A limited set of tasks: binary classification, multi classification and regression
  • A single linear algorithm
  • A limited choice of metrics to assess the quality of the prediction
  • A simple set of tuning parameters for the underlying predictive algorithm

That somewhat constrained environment is simple enough while addressing most predictive analytics problems relevant to business. It can be leveraged across an array of different industries and use cases.

Leveraging full AWS integration

The AWS data ecosystem of pipelines, storage, environments, and Artificial Intelligence (AI) is also a strong argument in favor of choosing Amazon ML as a business platform for its predictive analytics needs. Although Amazon ML is simple, the service evolves to greater complexity and more powerful features once it is integrated in a larger structure of AWS data related services. 

AWS is already a major actor in cloud computing. Here's what an excerpt from The Economist, August  2016 has to say about AWS (http://www.economist.com/news/business/21705849-how-open-source-software-and-cloud-computing-have-set-up-it-industry):

AWS shows no sign of slowing its progress towards full dominance of cloud computing's wide skies. It has ten times as much computing capacity as the next 14 cloud providers combined, according to Gartner, a consulting firm. AWS's sales in the past quarter were about three times the size of its closest competitor, Microsoft's Azure.

This gives an edge to Amazon ML, as many companies that are using cloud services are likely to be already using AWS. Adding simple and efficient machine learning tools to the product offering mix anticipates the rise of predictive analytics features as a standard component of web services. Seamless integration with other AWS services is a strong argument in favor of using Amazon ML despite its apparent simplicity.

The following architecture is a case study taken from an AWS January 2016 white paper titled Big Data Analytics Options on AWS (http://d0.awsstatic.com/whitepapers/Big_Data_Analytics_Options_on_AWS.pdf), showing a potential AWS architecture for sentiment analysis on social media. It shows how Amazon ML can be part of a more complex architecture of AWS services:

Comparing performances

Keeping systems and applications simple is always difficult, but often worth it for the business. Examples abound with overloaded UIs bringing down the user experience, while products with simple, elegant interfaces and minimal features enjoy widespread popularity. The Keep It Simple mantra is even more difficult to adhere to in a context such as predictive analytics where performance is key. This is the challenge Amazon took on with its Amazon ML service.

A typical predictive analytics project is a sequence of complex operations: getting the data, cleaning the data, selecting, optimizing and validating a model and finally making predictions. In the scripting approach, data scientists develop codebases using machine learning libraries such as the Python scikit-learn library or R packages to handle all these steps from data gathering to predictions in production. As a developer breaks down the necessary steps into modules for maintainability and testability, Amazon ML breaks down a predictive analytics project into different entities: datasource, model, evaluation and predictions. It's the simplicity of each of these steps that makes AWS so powerful to implement successful predictive analytics projects.

Engineering data versus model variety

Having a large choice of algorithms for your predictions is always a good thing, but at the end of the day, domain knowledge and the ability to extract meaningful features from clean data is often what wins the game.

Kaggle is a well-known platform for predictive analytics competitions, where the best data scientists across the world compete to make predictions on complex datasets. In these predictive competitions, gaining a few decimals on your prediction score is what makes the difference between earning the prize or being just an extra line on the public leaderboard among thousands of other competitors. One thing Kagglers quickly learn is that choosing and tuning the model is only half the battle. Feature extraction or how to extract relevant predictors from the dataset is often the key to winning the competition.

In real life, when working on business related problems, the quality of the data processing phase and the ability to extract meaningful signal out of raw data is the most important and time consuming part of building an efficient predictive model. It is well know that "data preparation accounts for about 80% of the work of data scientists" (http://www.forbes.com/sites/gilpress/2016/03/23/data-preparation-most-time-consuming-least-enjoyable-data-science-task-survey-says/). Model selection and algorithm optimization remains an important part of the work but is often not the deciding factor when implementation is concerned.

A solid and robust implementation that is easy to maintain and connects to your ecosystem seamlessly is often preferred to an overly complex model developed and coded in-house, especially when the scripted model only produces small gains when compared to a service based implementation.

Amazon's expertise and the gradient descent algorithm

Amazon has been using machine learning for the retail side of its business and has build a serious expertise in predictive analytics. This expertise translates into the choice of algorithm powering the Amazon ML service.

The Stochastic Gradient Descent (SGD) algorithm is the algorithm powering Amazon ML linear models and is ultimately responsible for the accuracy of the predictions generated by the service. The SGD algorithm is one of the most robust, resilient, and optimized algorithms. It has been used in many diverse environments, from signal processing to deep learning and for a wide variety of problems, since the 1960s with great success. The SGD has also given rise to many highly efficient variants adapted to a wide variety of data contexts. We will come back to this important algorithm in a later chapter; suffice it to say at this point that the SGD algorithm is the Swiss army knife of all possible predictive analytics algorithm.

Several benchmarks and tests of the Amazon ML service can be found across the web (Amazon, Google and Azure: https://blog.onliquid.com/machine-learning-services-2/ and Amazon versus scikit-learn: http://lenguyenthedat.com/minimal-data-science-2-avazu/). Overall results show that the Amazon ML performance is on a par with other MLaaS platforms, but also with scripted solutions based on popular machine learning libraries such as scikit-learn.

For a given problem in a specific context and with an available dataset and a particular choice of a scoring metric, it is probably possible to code a predictive model using an adequate library and obtain better performances than the ones obtained with Amazon ML. But what Amazon ML offers is stability, absence of coding, and a very solid benchmark record, as well as a seamless integration with the Amazon Web Services ecosystem that already powers a large portion of the Internet.

Pricing

As with other MLaaS providers and AWS services, Amazon ML only charges for what you consume.

The cost is broken down into the following:

  • An hourly rate for the computing time used to build predictive models
  • A prediction fee per thousand prediction samples
  • And in the context of real-time (streaming) predictions, a fee based on the memory allocated upfront for the model

The computational time increases as a function of the following:

  • The complexity of the model
  • The size of the input data
  • The number of attributes
  • The number and types of transformations applied

At the time of writing, these charges are as follows:

  • $0.42 per hour for data analysis and model building fees
  • $0.10 per 1,000 predictions for batch predictions
  • $0.0001 per prediction for real-time predictions
  • $0.001 per hour for each 10 MB of memory provisioned for your model

These prices do not include fees related to the data storage (S3, Redshift, or RDS), which are charged separately. 

During the creation of your model, Amazon ML gives you a cost estimation based on the data source that has been selected.

The Amazon ML service is not part of the AWS free tier, a 12-month offer applicable to certain AWS services for free under certain conditions.

Understanding predictive analytics


Data Science, predictive analytics, machine learning -- these terms are used in many ways and sometimes overlap each other. What they actually refer to is not always obvious.

Data science is one of the most popular technical domains whose trend erupted after the publication of the often cited Harvard Business Review article of October 2012, Data Scientist: The Sexiest Job of the 21st Century (https://hbr.org/2012/10/data-scientist-the-sexiest-job-of-the-21st-century). Data science can be seen as an evolution from data mining and data analytics. Data mining is about exploring data to discover patterns that potentially lead to decisions and actions at the business level. Data science englobes data analytics and regroups a wider scope of domains, such as statistics, data visualization, predictive analytics, software engineering, and so on, under one very large umbrella.

Predictive analytics is the art of predicting future events based on past observations. It requires your data to be organized in a certain way with predictor variables and outcomes well identified. As the Danish politician Karl Kristian Steincke once said, "Making predictions is difficult especially about the future." (This quote has also been attributed to Niels Bohr, Yogi Berra and others by http://quoteinvestigator.com/2013/10/20/no-predict/). Predictive analytics applications are diverse and far ranging: predicting consumer behavior, natural events (weather, earthquakes, and so on), people's behavior or health, financial markets, industrial applications, and so on. Predictive analytics relies on supervised learning, where data and labels are given to train the model.

Machine learning comprises the tools, methods, and concepts for computers to optimize models used for predictive analytics or other goals.

Machine learning's scope is much larger than predictive analytics. Three different types of machine learning are usually considered:

  • Supervised learning: Assumes that a certain amount of training data with known outcomes is available and can be used to train the model. Predictive analytics is part of supervised learning.
  • Unsupervised learning: Is about finding patterns in existing data without knowing the outcome. Clustering customer behavior or reducing the dimensions of the dataset for visualization purposes are examples of unsupervised learning.
  • Reinforcement learning: Is the third type of machine learning, where agents learn to act on their own when given a set of rules and a specific reward schema. Examples of reinforcement learning applications include AlphaGo, Google's world championship Go algorithm, self-driving cars, and semi-autonomous robots. AlphaGo learned from thousands of past games and was able to beat the world Go champion in March 2016 (https://www.wired.com/2016/03/go-grandmaster-lee-sedol-grabs-consolation-win-googles-ai/). A classic reinforcement learning implementation follows this schema, where an agent adapts its actions on an environment based on the resulting rewards:

The difference between supervised and unsupervised learning in the context of binary classification and clustering is illustrated in the following two figures:

  • For supervised learning, the original dataset is composed of two classes (squares and circles), and we know from the start to which class each sample belongs. Giving that information to a binary classification algorithm allows for a somewhat optimized separation of the two classes. Once that separating frontier is known, the model (the line) can be used to predict the class of new samples depending on which side the sample ends up being:
  • In unsupervised learning, the different classes are not known. There is no ground truth. The data is given to an algorithm along with some parameters, such as the number of classes to be found, and the algorithm finds the best set of clusters in the original dataset according to a defined criteria or metric. The results may be very dependent on the initialization parameters. There is no truth, no accuracy, just an interpretation of the data. The following figure shows the results obtained by a clustering algorithm asked to find three classes in the original data:

The reader will notice at this point that the book is titled Amazon Machine Learning and not Amazon Predictive Analytics. This is a bit misleading, as machine learning covers many applications and problems besides predictive analytics. However, calling the service machine learning leaves the door open for Amazon to roll out future services that are not focused on predictive analytics. The following figure maps out the relationships between data science terms:

Building the simplest predictive analytics algorithm

Predictive analytics can be very simple. We introduce a very simple example of a predictive model in the context of binary classification based on a simple threshold.

Imagine that a truck transporting small oranges and large grapefruits runs off the road; all the boxes of fruits open up, and all the fruits end up mixed together. Equipped with a simple weighing scale and a way to roll the fruits out of the truck, you want to be able to separate them automatically based on their weights. You have some information on the average weights of small oranges (96g) and large grapefruits (166g).

Note

According to the USDA, the average weight of a medium-sized orange is 131 grams, while a larger orange weighs approximately 184 grams, and a smaller one around 96 grams. 

  • Large grapefruit (approx 4-1/2'' dia) 166g
  • Medium grapefruit (approx 4'' dia) 128g
  • Small grapefruit (approx 3-1/2'' dia) 100g

Your predictive model is the following:

  • You arbitrarily set a threshold of 130g
  • You weigh each fruit
  • If the fruit weighs more than 130g, it's a grapefruit; otherwise it's an orange

There! You have a robust reliable, predictive model that can be applied to all your mixed up fruits to separate them. Note that in this case, you've set the threshold with an educated guess. There was no machine learning involved.

In machine learning, the models learn by themselves. Instead of setting the threshold yourself, you let your program evolve and calculate the weight separation threshold of fruits by itself.

For that, you would set aside a certain number of oranges and grapefruits. This is called the training dataset. It's important that this training dataset has roughly the same number of oranges and grapefruits.

And you let the machine decide the threshold value by itself. A possible algorithm could be along these lines:

  1. Set original weight estimation at w_0 = 100g to initialize and a counter k = 0
  2. For each new fruit in the training dataset, adjust the weight estimation according to the following:
        For each new fruit_weight:
            w(k+1) = (k*w(k) + fruit_weight)/ (k+1)
            k = k+1

Assuming that your training dataset is representative of all the remaining fruits and that you have enough fruits, the threshold would converge under certain conditions to the best average between all the fruit weights. A value which you use to separate all the other fruits depending on whether they weight more or less than the threshold you estimated. The following plot shows the convergence of this crude algorithm to estimate the average weight of the fruits:

This problem is a typical binary classification model. If we had not two but three types of fruits (lemons, oranges, and grapefruit), we would have a multiclass classification problem.

In this example, we only have one predictor: the weight of the fruit. We could add another predictor such as the diameter. This would result in what is called a multivariate classification problem.

In practice, machine learning uses more complex algorithms such as the SGD, the linear algorithm used by Amazon ML. Other classic prediction algorithms include Support Vector Machines, Bayes classifiers, Random forests and so on. Each algorithm has its strength and set of assumptions on the dataset.

Regression versus classification

Amazon ML does two types of predictive analytics: classification and regression.

As discussed in the preceding paragraph, classification is about predicting a finite set of labels or categories for a given set of samples.

  • In the case of two classes, the problem is called Binary classification
  • When there are more than two classes and the classes are mutually exclusive, the problem is a multiclass classification problem
  • If the samples can belong to several classes at once, we talk about a multilabel classification problem

In short, classification is the prediction of a finite set of classes, labels, categories.

  • Examples of Binary classification are: buying outcome (yes/no), survival outcome (yes/no), anomaly detection (spam, bots), and so on
  • Examples of multiclass classification are: classifying object in images (fruits, cars, and so on), identifying a music genre, or a movement based on smartphone sensors, document classification and so on

In regression problems, the outcome has continuous values. Predicting age, weight, stock prices, salaries, rainfall, temperature, and so forth are all regression problems. We talk about multiple regression when there are several predictors and multivariate regression when the predictions predict several values for each sample. Amazon ML does univariate regression and classification, both binary and multiclass, but not multilabel.

Expanding regression to classification with logistic regression

Amazon ML uses a linear regression model for regression, binary, and multiclass predictions. Using the logistic regression model extends continuous regression to classification problems.

A simple regression model with one predictor is modeled as follows:

Here, x is the predictor, y is the outcome, and (a, b) are the model parameters. Each predicted value y is continuous and not bounded. How can we use that model to predict classes which are by definition categorical values?

Take the example of binary predictions. The method is to transform the continuous predictions that are not bounded into probabilities, which are all between 0 and 1. We then associate these probabilities to one of the two classes using a predefined threshold. This model is called the logistic regression model–misleading name as logistic regression is a classification model and not a regression one.

To transform continuous not bounded values into probabilities, we use the sigmoid function defined as follows:

This function transforms any real number into a value within the [0,1] interval. Its output can, therefore, be interpreted as a probability:

In conclusion, the way to do binary classification with a regression model is as follows:

  1. Build the regression model, and estimate the real valued outcomes y.
  2. Use the predicted value y as the argument of the sigmoid function. The result f(y) is a probability measure of belonging to one of the two classes.
  3. Set a threshold T in [0,1]. All predicted samples with a probability f(y) > T belong to one class, others belong to the other class. The default value for T = 0.5.

Logistic regression is, by nature, a Binary classifier. There are several strategies to transform a binary classifier into a multi class classifier.

The one versus all (OvA) technique consists in selecting one class as positive and all the others as negative to go back to a binary classification problem. Once the classification on the first class is carried out, a second class is selected as the positive versus all the others as negative. This process is repeated N-1 times when there are N classes to predict. The following set of plots shows:

  • The original datasets and the classes for all the samples
  • The result of the first Binary classification (circles versus all the others)
  • The result of the second classification that separates the squares and the triangles

Extracting features to predict outcomes

That available data needs to be accessible and meaningful in order for the algorithm to extract information.

Let's consider a simple example. Imagine that we want to predict the market price of a house in a given city. We can think of many variables that would be predictors of the price of a house: the number of rooms or bathrooms, the neighborhood, the surface, the heating system, and so on. These variables are called features, attributes, or predictors. The value that we want to predict is called the outcome or the target.

If we want our predictions to be reliable, we need several features. Predicting the price of a house based on its surface alone would not be very efficient. Many other factors influence the price of a house and our dataset should include as many as possible (with conditions).

It's often possible to add large numbers of attributes to a model to try to improve the predictions. For instance, in our housing pricing prediction, we could add all the characteristics of the house (bathroom, superficies, heating system, the number of windows). Some of these variables would bring more information to our pricing model and increase the accuracy of our predictions, while others would just add noise and confuse the algorithm. Adding new variables to a predicting model does not always improve the predictions.

In order to make reliable predictions, each of the new features you bring to your model must bring some valuable piece of information. However, this is also not always the case. As we will see in Chapter 2, Machine Learning Definitions and Concepts, correlated predictors can hurt the performances of the model.

Predictive analytics is built on several assumptions and conditions:

  • The value you are trying to predict is predictable and not just some random noise.
  • You have access to data that has some degree of association to the target.
  • The available dataset is large enough. Reliable predictions cannot be inferred from a dataset that is too small. (For instance, you can define and therefore predict a line with two points but you cannot infer data that follows a sine curve from only two points.)
  • The new data you will base future predictions on is similar to the one you parameterized and trained your model on.

You may have a great dataset, but that does not mean it will be efficient for predictions.

These conditions on the data are very general. In the case of SGD, the conditions are more constrained.

Diving further into linear modeling for prediction


Amazon ML is based on linear modeling. Recall the equation for a straight line in the plan:

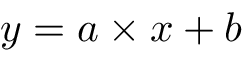
This linear equation with coefficients (a, b) can be interpreted as a predictive linear model with x as the predictor and y as the outcome. In this simple case, we have two parameters (a, b) and one predictor x. An example can be that of predicting the height of children with respect to their weight and find some a and b such that the following equation is true:

Let's consider the classic Lewis Taylor (1967) dataset with 237 samples of children's age, weight, height, and gender (https://v8doc.sas.com/sashtml/stat/chap55/sect51.htm) and focus on the relation between the height and weight of the children. In this dataset, the optimal regression line follows the following equation:

The following figure illustrates the height versus weight dataset and the associated linear regression:

Consider now that we have not one predictor but several, and let's generalize the preceding linear equation to N predictors denoted by {x1, . . . , xn} and N +1 coefficients or {wo, w1, . . ., wn} weights. The linear model can be written as follows:

Here, ŷ denotes the predicted value, (y would correspond to the true value to be predicted). To simplify notations, we will assume for the rest of the book the coefficient wo = 0.

This equation can be rewritten in vector form as follows:

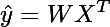
Where T is the transpose operator, X = {x1, . . ., xn} and  W= {w1, . . .,wn} are the respective vectors of predictors and model weights. Under certain conditions, the coefficients wi can be calculated precisely. However, for a large number of samples N, these calculations are expensive in terms of required computations as they involve inverting matrices of dimension N, which for large datasets is costly and slow. As the number of samples grows, it becomes more efficient to estimate these model coefficients via an iterative process.

The Stochastic Gradient Descent algorithm iteratively estimates the coefficients {wo, w1, . . ., wn} of the model. At each iteration, it uses a random sample of the training dataset for which the real outcome value is known. The SGD algorithm works by minimizing a function of the prediction error:

Functions that take the prediction error as argument are also called loss functions. Different loss functions result in different algorithms. A convex loss function has a unique minimum, which corresponds to the optimal set of weights for the regression problem. We will come back to the SGD algorithm in details in later chapters. Suffice to say for now that the SGD algorithm is especially well-suited to deal with large datasets.

There are many reasons to justify selecting the SGD algorithm for general purpose predictive analysis problems:

  • It is robust
  • Its convergence properties have been extensively studied and are well known
  • It is well adapted to optimization techniques
  • It has many extensions and variants
  • It has low computational cost
  • It can be applied to regression, classification, and streaming data

Some weaknesses include the following:

  • The need to properly initialize its parameters
  • A convergence rate dependent on a parameter called the learning rate

Validating the dataset

Not all datasets lend themselves to linear modeling. There are several conditions that the samples must verify for your linear model to make sense. Some conditions are strict, others can be relaxed.

In general, linear modeling assumes the following conditions (http://www.statisticssolutions.com/assumptions-of-multiple-linear-regression/):

  • Normalization/standardization: Linear regression can be sensitive to predictors that exhibit very different scales. This is true for all loss functions that rely on a measure of the distance between samples or on the standard deviations of samples. Predictors with higher means and standard deviations have more impact on the model and may potentially overshadow predictors with better predictive power but more constrained range of values. Standardization of predictors puts all the predictors on the same level.
  • Independent and identically distributed (i.i.d.): The samples are assumed to be independent from each other and to follow a similar distribution. This property is often assumed even when the samples are not that independent from each other. In the case of time series where samples depend on previous values, using the sample to sample difference as the data is often enough to satisfy the independence assumption. As we will see in Chapter 2, Machine Learning Definitions and Concepts, confounders and noise will also negatively impact linear regression.
  • No multicollinearity: Linear regression assumes that there is little or no multicollinearity in the data, meaning that one predictor is not a linear composition of other predictors. Predictors that can be approximated by linear combinations of other predictors will confuse the model.
  • Heteroskedasticity: The standard deviation of a predictor is constant across the whole range of its values.
  • Gaussian distribution of the residuals: This is more than a posteriori validation that the linear regression is valid. The residuals are the differences between the true values and their linear estimation. The linear regression is considered relevant if these residuals follow a Gaussian distribution.

These assumptions are rarely perfectly met in real-life datasets. As we will see in Chapter 2, Machine Learning Definitions and Concepts, there are techniques to detect when the linear modeling assumptions are not respected, and subsequently to transform the data to get closer to the ideal linear regression context.

Missing from Amazon ML

Amazon ML offers supervised learning predictions for classification (binary and multiclass) and regression problems. It offers some very basic visualization of the original data and has a preset list of data transformations, such as binning or normalizing the data. It is efficient and simple. However, several functionalities that are important to the data scientist are unfortunately missing from the platform. Lacking these features may not be a deal breaker, but it nonetheless restricts the scope of problems Amazon ML can be applied to.

Some of the common machine learning features Amazon ML does not offer are as follows:

  • Unsupervised learning: It is not possible to do clustering or dimensionality reduction of your data.
  • A choice of models beside linear models: Non-linear Support Vector Machines, any type of Bayes classification, neural networks, and tree, based algorithms (decision trees, random forests, or boosted trees) are all absent models. All predictions, all experiments will be built on linear regression and logistic regression with the SGD.
  • Data visualization capabilities are reduced to histograms and density plots.
  • A choice of metrics: Amazon ML uses F1-score and ROC-AUC metrics for classification, and MSE for regression. It is not possible to assess the model performance with any other metric.
  • You cannot download your trained model and use it anywhere else than Amazon ML.

Finally, although it is not possible to directly use your own scripts (R, Python, Scala, and so on) within the Amazon ML platform, it is possible and recommended to use other AWS services, such as AWS Lambda, to preprocess the datasets. Data manipulation beyond the transformations available in Amazon ML can also be carried out with SQL if your data is stored in one of the AWS SQL enabled services (Athena, RDS, Redshift, and others).

The statistical approach versus the machine learning approach

In 2001, Leo Breiman published a paper titled Statistical Modeling: The Two Cultures (http://projecteuclid.org/euclid.ss/1009213726) that underlined the differences between the statistical approach focused on validation and explanation of the underlying process in the data and the machine learning approach, which is more concerned with the results.

Roughly put, a classic statistical analysis follows steps such as the following:

  1. A hypothesis called the null hypothesis is stated. This null hypothesis usually states that the observation is due to randomness.
  2. The probability (or p-value) of the event under the null hypothesis is then calculated.
  3. If that probability is below a certain threshold (usually p < 0.05), then the null hypothesis is rejected, which means that the observation is not a random fluke.

Note

p> 0.05 does not imply that the null hypothesis is true. It only means that you cannot reject it, as the probability of the observation happening by chance is not large enough.

This methodology is geared toward explaining and discovering the influencing factors of the phenomenon. The goal here is to establish/build a somewhat static and fully known model that will fit observations as well as possible and, therefore, will be able to predict future patterns, behaviors, and observations.

In the machine learning approach, in predictive analytics, an explicit representation of the model is not the focus. The goal is to build the best model for the prediction period, and the model builds itself from the observations. The internals of the models are not explicit. This machine learning approach is called a black box model.

By removing the need for explicit modeling of the data, the ML approach has a stronger potential for predictions. ML is focused on making the most accurate predictions possible by minimizing the prediction error of a model at the expense of explainability. 

Summary


In this introductory chapter, we presented the techniques used by the Amazon ML service. Although Amazon ML offers fewer features than other machine learning workflows, Amazon ML is built on a solid ground, with a simple yet very efficient algorithm driving its predictions.

Amazon ML does not offer to solve any type of automated learning problems and will not be adequate in some contexts and some datasets. However, its simple approach and design will be sufficient for many predictive analytics projects, on the condition that the initial dataset is properly preprocessed and contains relevant signals on which predictions can be made.

In Chapter 2, Machine Learning Definitions and Concepts, we will dive further into techniques and concepts used in predictive analytics.

More precisely, we will present the most common techniques used to improve the quality of raw data; we will spot and correct common anomalies within a dataset; we will learn how to train and validate a predictive model and how to improve the predictions when faced with poor predictive performance.

Left arrow icon Right arrow icon
Download code icon Download Code

Key benefits

  • Create great machine learning models that combine the power of algorithms with interactive tools without worrying about the underlying complexity
  • Learn the What’s next? of machine learning—machine learning on the cloud—with this unique guide
  • Create web services that allow you to perform affordable and fast machine learning on the cloud

Description

Predictive analytics is a complex domain requiring coding skills, an understanding of the mathematical concepts underpinning machine learning algorithms, and the ability to create compelling data visualizations. Following AWS simplifying Machine learning, this book will help you bring predictive analytics projects to fruition in three easy steps: data preparation, model tuning, and model selection. This book will introduce you to the Amazon Machine Learning platform and will implement core data science concepts such as classification, regression, regularization, overfitting, model selection, and evaluation. Furthermore, you will learn to leverage the Amazon Web Service (AWS) ecosystem for extended access to data sources, implement realtime predictions, and run Amazon Machine Learning projects via the command line and the Python SDK. Towards the end of the book, you will also learn how to apply these services to other problems, such as text mining, and to more complex datasets.

What you will learn

[*]Learn how to use the Amazon Machine Learning service from scratch for predictive analytics [*]Gain hands-on experience of key Data Science concepts [*]Solve classic regression and classification problems [*]Run projects programmatically via the command line and the Python SDK [*]Leverage the Amazon Web Service ecosystem to access extended data sources [*]Implement streaming and advanced projects

Product Details

Country selected

Publication date : Apr 25, 2017
Length 306 pages
Edition : 1st Edition
Language : English
ISBN-13 : 9781785883231
Vendor :
Amazon
Category :

What do you get with eBook?

Product feature icon Instant access to your Digital eBook purchase
Product feature icon Download this book in EPUB and PDF formats
Product feature icon Access this title in our online reader with advanced features
Product feature icon DRM FREE - Read whenever, wherever and however you want
Buy Now

Product Details


Publication date : Apr 25, 2017
Length 306 pages
Edition : 1st Edition
Language : English
ISBN-13 : 9781785883231
Vendor :
Amazon
Category :

Table of Contents

17 Chapters
Title Page Chevron down icon Chevron up icon
Credits Chevron down icon Chevron up icon
About the Author Chevron down icon Chevron up icon
About the Reviewer Chevron down icon Chevron up icon
www.PacktPub.com Chevron down icon Chevron up icon
Customer Feedback Chevron down icon Chevron up icon
Dedication Chevron down icon Chevron up icon
Preface Chevron down icon Chevron up icon
1. Introduction to Machine Learning and Predictive Analytics Chevron down icon Chevron up icon
2. Machine Learning Definitions and Concepts Chevron down icon Chevron up icon
3. Overview of an Amazon Machine Learning Workflow Chevron down icon Chevron up icon
4. Loading and Preparing the Dataset Chevron down icon Chevron up icon
5. Model Creation Chevron down icon Chevron up icon
6. Predictions and Performances Chevron down icon Chevron up icon
7. Command Line and SDK Chevron down icon Chevron up icon
8. Creating Datasources from Redshift Chevron down icon Chevron up icon
9. Building a Streaming Data Analysis Pipeline Chevron down icon Chevron up icon

Customer reviews

Top Reviews
Rating distribution
Empty star icon Empty star icon Empty star icon Empty star icon Empty star icon 0
(0 Ratings)
5 star 0%
4 star 0%
3 star 0%
2 star 0%
1 star 0%
Top Reviews
No reviews found
Get free access to Packt library with over 7500+ books and video courses for 7 days!
Start Free Trial

FAQs

How do I buy and download an eBook? Chevron down icon Chevron up icon

Where there is an eBook version of a title available, you can buy it from the book details for that title. Add either the standalone eBook or the eBook and print book bundle to your shopping cart. Your eBook will show in your cart as a product on its own. After completing checkout and payment in the normal way, you will receive your receipt on the screen containing a link to a personalised PDF download file. This link will remain active for 30 days. You can download backup copies of the file by logging in to your account at any time.

If you already have Adobe reader installed, then clicking on the link will download and open the PDF file directly. If you don't, then save the PDF file on your machine and download the Reader to view it.

Please Note: Packt eBooks are non-returnable and non-refundable.

Packt eBook and Licensing When you buy an eBook from Packt Publishing, completing your purchase means you accept the terms of our licence agreement. Please read the full text of the agreement. In it we have tried to balance the need for the ebook to be usable for you the reader with our needs to protect the rights of us as Publishers and of our authors. In summary, the agreement says:

  • You may make copies of your eBook for your own use onto any machine
  • You may not pass copies of the eBook on to anyone else
How can I make a purchase on your website? Chevron down icon Chevron up icon

If you want to purchase a video course, eBook or Bundle (Print+eBook) please follow below steps:

  1. Register on our website using your email address and the password.
  2. Search for the title by name or ISBN using the search option.
  3. Select the title you want to purchase.
  4. Choose the format you wish to purchase the title in; if you order the Print Book, you get a free eBook copy of the same title. 
  5. Proceed with the checkout process (payment to be made using Credit Card, Debit Cart, or PayPal)
Where can I access support around an eBook? Chevron down icon Chevron up icon
  • If you experience a problem with using or installing Adobe Reader, the contact Adobe directly.
  • To view the errata for the book, see www.packtpub.com/support and view the pages for the title you have.
  • To view your account details or to download a new copy of the book go to www.packtpub.com/account
  • To contact us directly if a problem is not resolved, use www.packtpub.com/contact-us
What eBook formats do Packt support? Chevron down icon Chevron up icon

Our eBooks are currently available in a variety of formats such as PDF and ePubs. In the future, this may well change with trends and development in technology, but please note that our PDFs are not Adobe eBook Reader format, which has greater restrictions on security.

You will need to use Adobe Reader v9 or later in order to read Packt's PDF eBooks.

What are the benefits of eBooks? Chevron down icon Chevron up icon
  • You can get the information you need immediately
  • You can easily take them with you on a laptop
  • You can download them an unlimited number of times
  • You can print them out
  • They are copy-paste enabled
  • They are searchable
  • There is no password protection
  • They are lower price than print
  • They save resources and space
What is an eBook? Chevron down icon Chevron up icon

Packt eBooks are a complete electronic version of the print edition, available in PDF and ePub formats. Every piece of content down to the page numbering is the same. Because we save the costs of printing and shipping the book to you, we are able to offer eBooks at a lower cost than print editions.

When you have purchased an eBook, simply login to your account and click on the link in Your Download Area. We recommend you saving the file to your hard drive before opening it.

For optimal viewing of our eBooks, we recommend you download and install the free Adobe Reader version 9.