One of the best ways to present your data is via an interactive graphic on the web. The advantage of this approach is that its interactivity allows creators to pack more information into a single visualization, while the ubiquity of the web allows anyone to instantly access it. Gone are the days of PowerPoint presentations, or, worse still, printing static images on to paper as handouts. There are many ways to create a web-based interactive data visualization, but none of them is more popular than the JavaScript library called D3.js.
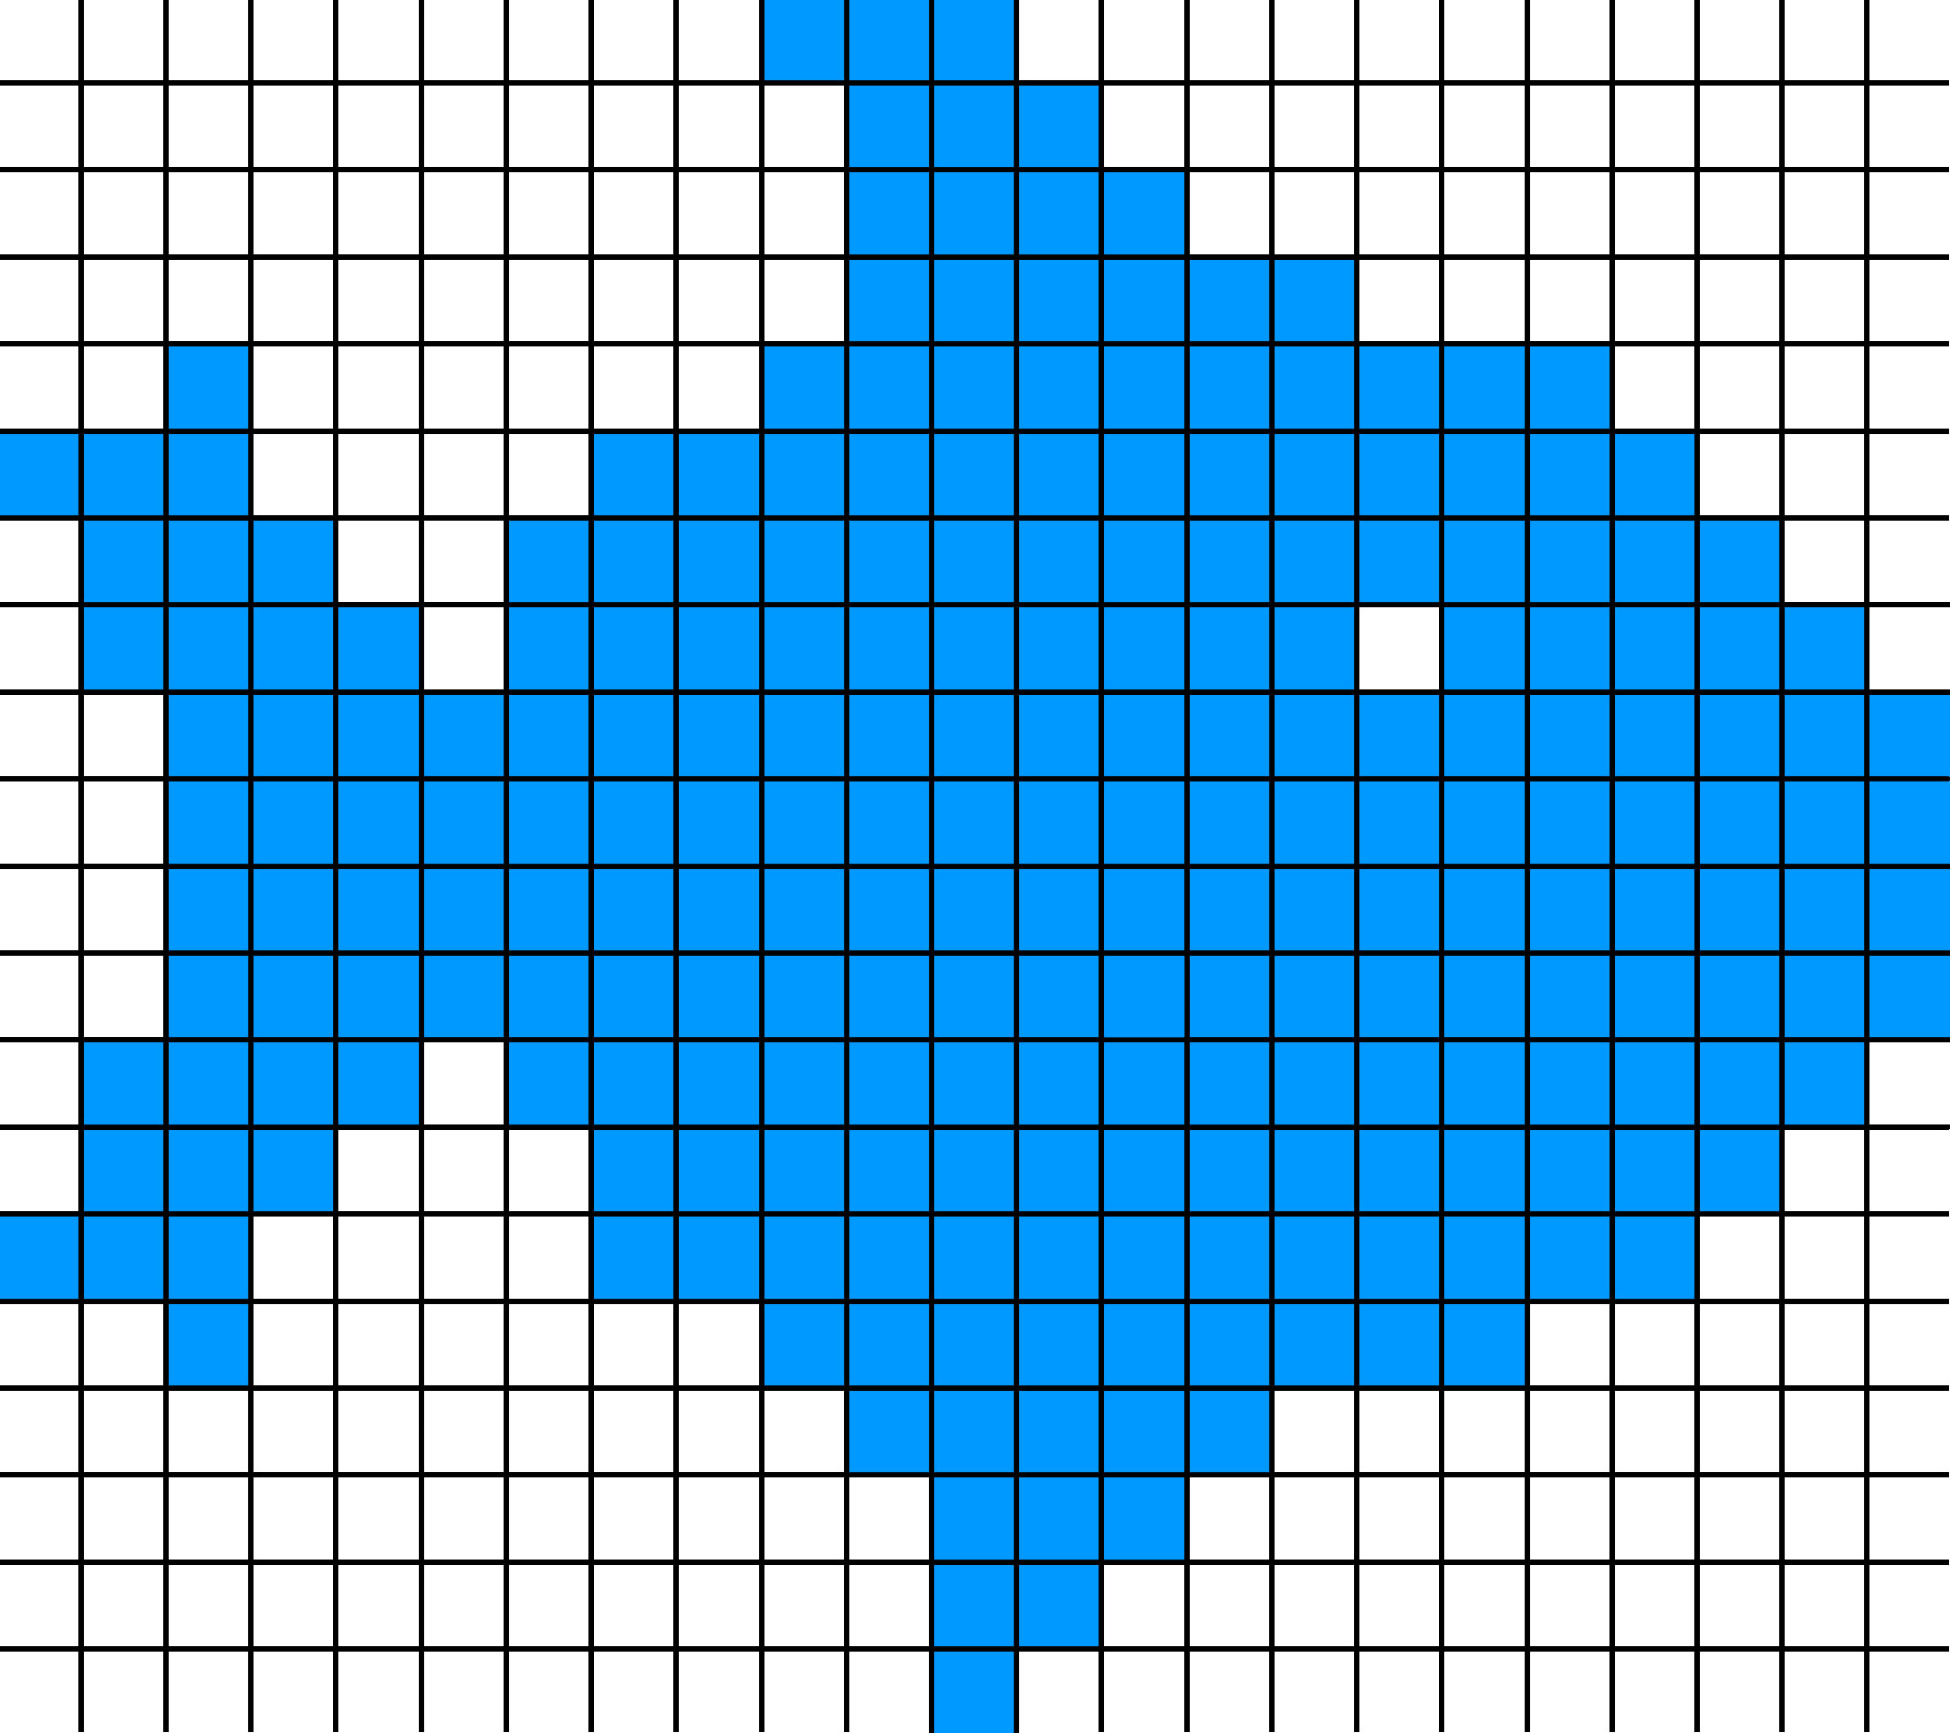
To understand why D3.js works so well, it's important to understand what SVG is and how it relates to D3. SVG stands for Scalable Vector Graphics, and it's a way to display shapes using mathematical directions/commands. Traditionally, the information for an image is stored in a grid, also called a raster. Each square (called a pixel) of the image has a specific color:

But with SVG, a set of succinct drawing directions is stored. For example, the drawing command for a circle is as follows:
<circle r=50><circle>This code produces a much smaller file size, and because it's a set of drawing directions, the image can be enlarged without any pixelation. A raster image becomes blurry and pixelated as it's enlarged. The advantage of raster graphics over vector graphics is that they're great for storing complex images such as photographs. With a photograph, where each pixel probably has a different color, it's better to use a raster image. Imagine writing SVG drawing commands for a photograph: you would end up creating a new element for each pixel, and the file size would be too large.
Once an SVG drawing command is written, a program needs to interpret the command and display the image. Up until recently, only designated drawing applications such as Adobe Illustrator could view and manipulate these images. But by 2011 all major modern browsers supported SVG tags, allowing for developers to embed SVG directly on a web page. Since the SVG image was directly embedded in the code of a web page, JavaScript, which normally is used for manipulating HTML, could be used to manipulate the shape, size, and colors of the image in response to user events. To make the circle in the SVG example you have just seen grow to twice its original size, all that JavaScript had to do was change the rattribute:
<circle r=100><circle>This was the massive breakthrough that allowed complex interactive data visualizations to be hosted on the web.


