Search icon CANCEL
Subscription
0
Cart icon
Your Cart (0 item)
Close icon
You have no products in your basket yet
Save more on your purchases! discount-offer-chevron-icon
Savings automatically calculated. No voucher code required.
Arrow left icon
Explore Products
Best Sellers
New Releases
Books
Videos
Audiobooks
Learning Hub
Free Learning
Arrow right icon
Arrow up icon
GO TO TOP
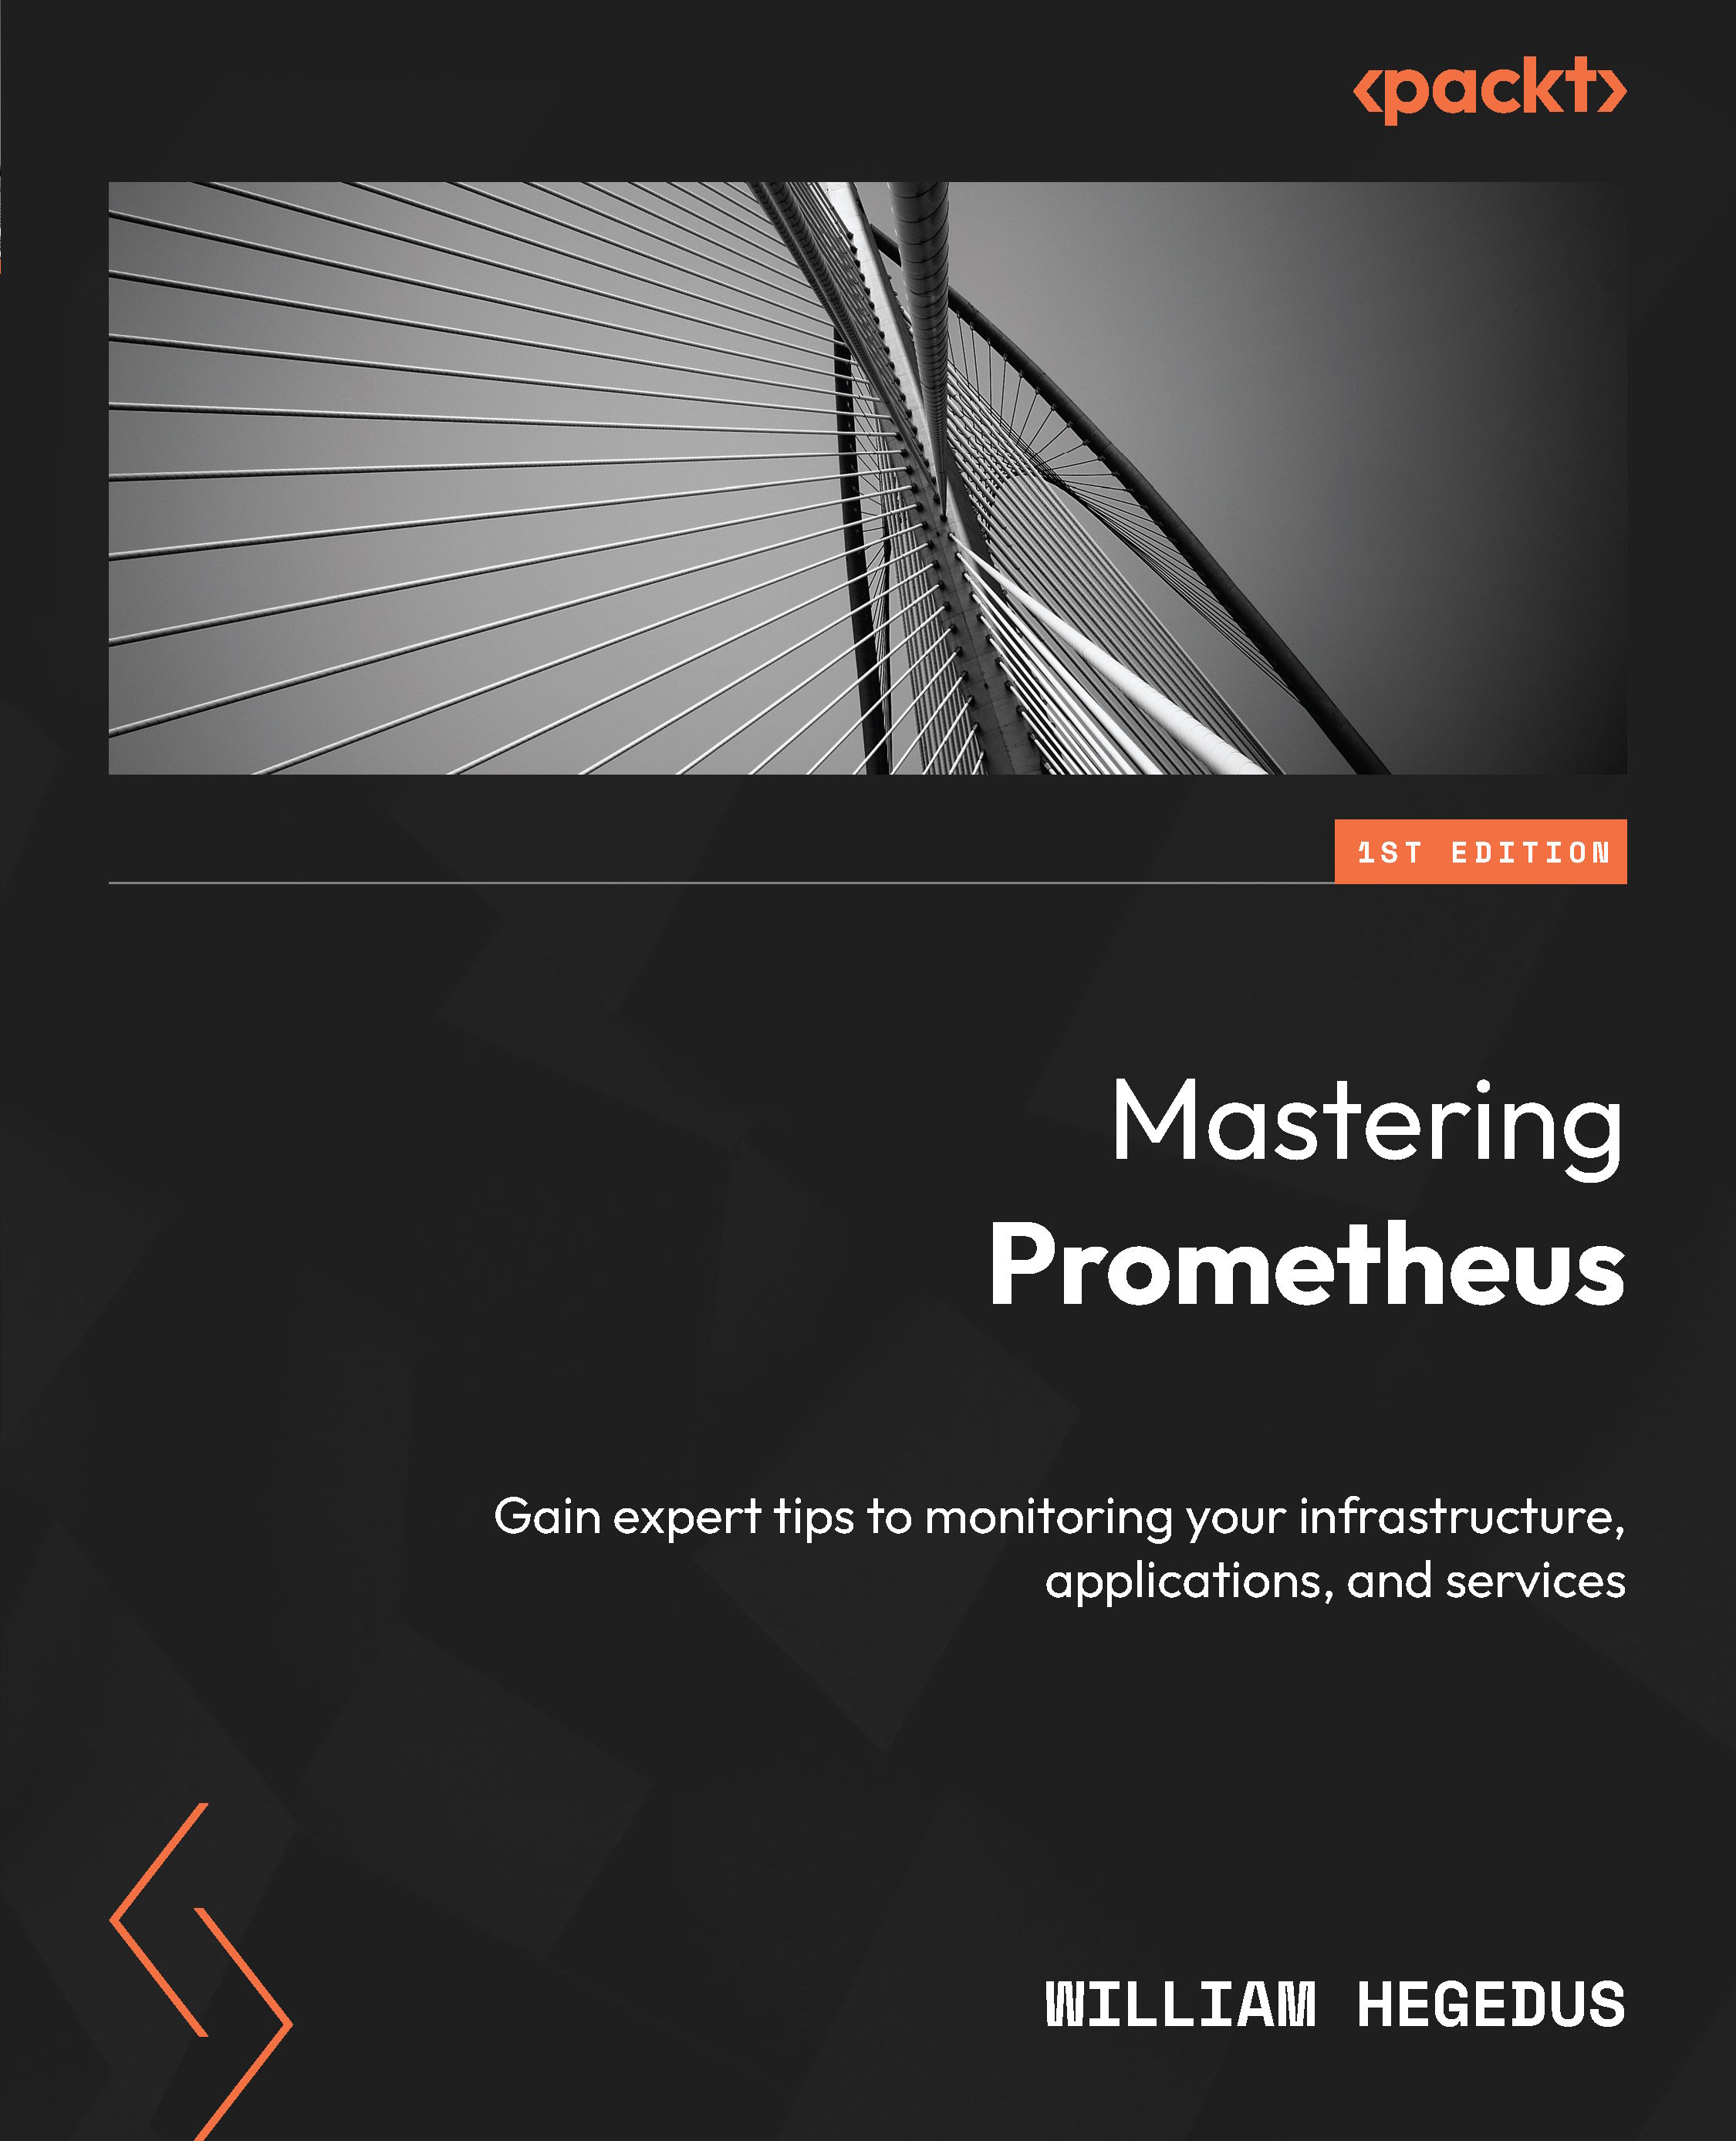
Mastering Prometheus

You're reading from   Mastering Prometheus Gain expert tips to monitoring your infrastructure, applications, and services

Arrow left icon
Product type Paperback
Published in Apr 2024
Publisher Packt
ISBN-13 9781805125662
Length 310 pages
Edition 1st Edition
Concepts
Arrow right icon
Author (1):
Arrow left icon
William Hegedus William Hegedus
Author Profile Icon William Hegedus
William Hegedus
Arrow right icon
View More author details
Toc

Table of Contents (21) Chapters Close

Preface 1. Part 1: Fundamentals of Prometheus FREE CHAPTER
2. Chapter 1: Observability, Monitoring, and Prometheus 3. Chapter 2: Deploying Prometheus 4. Chapter 3: The Prometheus Data Model and PromQL 5. Chapter 4: Using Service Discovery 6. Chapter 5: Effective Alerting with Prometheus 7. Part 2: Scaling Prometheus
8. Chapter 6: Advancing Prometheus: Sharding, Federation, and High Availability 9. Chapter 7: Optimizing and Debugging Prometheus 10. Chapter 8: Enabling Systems Monitoring with the Node Exporter 11. Part 3: Extending Prometheus
12. Chapter 9: Utilizing Remote Storage Systems with Prometheus 13. Chapter 10: Extending Prometheus Globally with Thanos 14. Chapter 11: Jsonnet and Monitoring Mixins 15. Chapter 12: Utilizing Continuous Integration (CI) Pipelines with Prometheus 16. Chapter 13: Defining and Alerting on SLOs 17. Chapter 14: Integrating Prometheus with OpenTelemetry 18. Chapter 15: Beyond Prometheus 19. Index 20. Other Books You May Enjoy

Summary

We’ve come to the end of our time together. I hope that you’ve enjoyed our time together as much as I have and that you’ve learned as much reading this book as I did writing it. Even with all the love I have for Prometheus, it is not the end-all-be-all of observability. It is but a piece in a much larger picture.

What precisely that picture looks like will vary from company to company and over time. As time progresses, new telemetry signals may become popular and be considered “core” observability signals. However, I feel confident in saying that metrics, logs, and traces are all here to stay. If you can build out your observability platform to cover all three of them, you’ll be in a better position to monitor and observe your systems than the majority of people in our industry.

So, go forth with your new-found knowledge and use Prometheus as the cornerstone of your observability platform. Build it, scale it, tweak it, and tune...

lock icon The rest of the chapter is locked
Register for a free Packt account to unlock a world of extra content!
A free Packt account unlocks extra newsletters, articles, discounted offers, and much more. Start advancing your knowledge today.
Unlock this book and the full library FREE for 7 days
Get unlimited access to 7000+ expert-authored eBooks and videos courses covering every tech area you can think of
Renews at $19.99/month. Cancel anytime
Banner background image