


Various Spectrogram formats
There are many parameters Pluto can pass to the underlying specgram() method from the Matplotlib library. He will highlight only a few parameters.
Fun fact
You can print any function documentation by adding a question mark (?) at the end of the function in the Python Notebook.
For example, printing the documentation for the specgram() function is the following command: matplotlib.pyplot.specgram? The partial output is as follows:
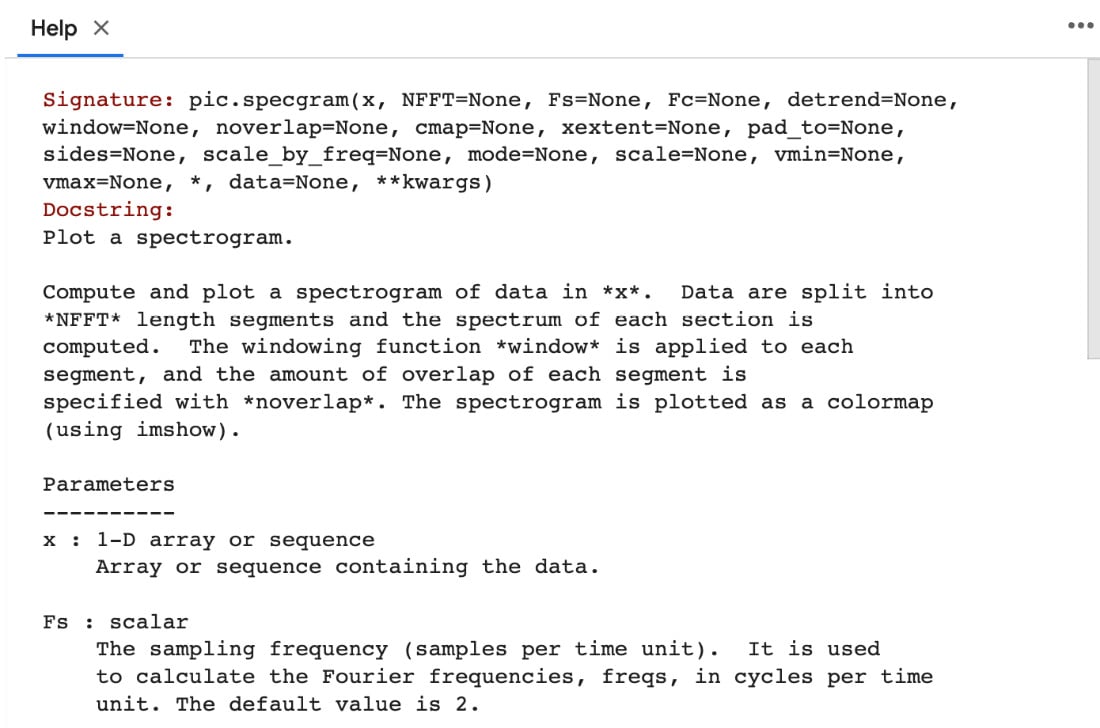
Figure 8.5 – Partial print definition of specgram()
You can view the complete output of Figure 8.5 in the Python Notebook. Another example is printing Pluto’s draw_spectrogram() function documentation as follows: pluto.draw_spectrogram?.
The output is as follows:
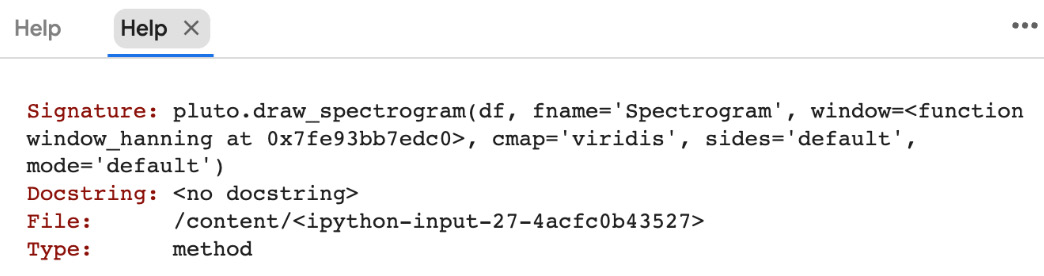
Figure 8.6 – The print definition of draw_spectrogram()
From Figure 8.5, the simple one is changing the color map (cmap) variable. There are more than 60 color maps in the Matplotlib...


