Starting your first network simulation
In ns-3 topologies, host or any network equipment are referred to as nodes with unique identifiers. We can view a node as a computing device. Based on our requirements, we can install necessary applications, and wired, wireless, or IP stacks to enable a given node as suitable network equipment or a suitable host or server. Besides this, to connect various nodes, ns-3 offers a variety of wired and wireless channels. In ns-3, nodes and channels are implemented using C++ classes. Usually, ns-3 simulation programs are written in C++ and saved with the .cc extension under the ns-allinone-3.36/ns-3.36/scratch/ folder. You can write an ns-3 program in any text editor or Code::Blocks like any other C++ program. Now, we will discuss our first simulation program (pkt_first.cc) for simulating a simple point-to-point (P2P) network topology.
First simulation implementation activity using ns-3
What do you want to learn and achieve in your first network simulation activity? Let's look at some suggestions:
- This is how to set up the following simple P2P network (shown in comments), which connects two hosts. In ns-3, the P2P module is a P2P data link available for connecting exactly two devices only using a
PointToPointHelperchannel class:// Simple Point to Point Network // 192.168.1.0 // Node 0 -------------- Node 1 // point-to-point channel // (Speed: 1Gbps, Propagation Delay: 1ms) // Install User Datagram Protocol (UDP) Echo Client on Node-0 // Install UDP Echo Server on Node-1
- Install the UDP echo client and server applications on Node-0 and Node-1 respectively and configure the following UDP echo client application traffic characteristics:
MaxPackets: Maximum packets to be sent (e.g., 10).Interval: At what speed the echo client application should send a packet. For example, settingIntervalto0.1means 10 packets are sent per second.PacketSize: Configure each packet size in terms of bytes (e.g., 1,024).
- Monitor how the UDP echo client and server exchange packets in the network.
- View the actual packets processed at Node-0 and Node-1.
- Generate an animation XML file that can be used with NetAnim later.
- Analyze UDP flow performance in terms of throughput, delay, jitter, and packet loss.
Now, we are going to explain step-by-step instructions for how to solve the preceding simulation activity using an ns-3 program, which will be saved under pkt_first.cc in the ns-allinone-3.36/ns-3.36/scratch/ folder:
- First, import all necessary ns-3 packages:
core-modulefor accessing all core features of ns-3, such as simulator activities in terms of handling events, starting and stopping simulation execution, logging, tracing, and attributes.network-modulefor accessing network socket features, packet representation, and so on.internet-modulefor accessing and installing TCP/IP protocols andapplications-modulefor installing various TCP/UDP applications on nodes.- Next, specific to our simulation, we use
point-to-point-moduleto access and use the P2P channel. - Finally, we use
netanim-moduleto enable animation support and useflow-monitor-moduleto collect flow-level statistics, such as throughput, delay, jitter, and packet loss:
#include "ns3/core-module.h"
#include "ns3/network-module.h"
#include "ns3/internet-module.h"
#include "ns3/applications-module.h"
#include "ns3/point-to-point-module.h"
#include "ns3/netanim-module.h"
#include "ns3/flow-monitor-module.h"
using namespace ns-3
- In ns-3, the actual simulation execution starts with the
main()function. Hence, we need to write our actual code in themain()function. We write the following relevant code inmain():- As per the topology diagram given in our simulation activity, we start by first creating two hosts as two nodes using
NodeContainer. - Then, we create and configure the P2P channel as per our requirements (1 Gbps speed, 1 ms delay) using
PointToPointHelper:
NodeContainer nodes; nodes.Create (2); PointToPointHelper pointToPoint; pointToPoint.SetDeviceAttribute ("DataRate", StringValue ("1Gbps")); pointToPoint.SetChannelAttribute ("Delay", StringValue ("1ms"));- Next, install the P2P protocol on the nodes, which connects them using the P2P channel. As a result, it returns two devices to the
NetDeviceContainerdevices: the first device is the Node-0 NIC and the second device is the Node-1 NIC:
  NetDeviceContainer devices;
  devices = pointToPoint.Install (nodes);
- Now, we install TCP/IP protocols on nodes. Then, we configure the IP addresses for the
NetDeviceContainerdevices under network ID192.168.1.0. As a result, Node-0 gets192.168.1.1and Node-1 gets192.168.1.2:
InternetStackHelper stack; stack.Install (nodes); Ipv4AddressHelper address; address.SetBase ("192.168.1.0", "255.255.255.0"); Ipv4InterfaceContainer interfaces = address.Assign (devices); - As per the topology diagram given in our simulation activity, we start by first creating two hosts as two nodes using
- Create traffic applications and install them on specific ns-3 nodes:
- First, create a UDP echo server application and install it on Node-1. Configure its start and stop timings:
  uint64_t port = 9;
  UdpEchoServerHelper echoServer (port);
  ApplicationContainer serverApps = echoServer.Install (nodes.Get (1));
  serverApps.Start (Seconds (1.0));
  serverApps.Stop (Seconds (10.0));
- Next, create a UDP echo client application and install it on Node-0. Configure its traffic characteristics, such as the maximum number of packets to be sent, packet-sending interval, and packet size. Then, configure UDP echo client start and stop timings as per the number of packets to be sent:
UdpEchoClientHelper echoClient (interfaces.GetAddress (1), port); echoClient.SetAttribute ("MaxPackets", UintegerValue (10000000)); echoClient.SetAttribute ("Interval", TimeValue (Seconds (0.001))); echoClient.SetAttribute ("PacketSize", UintegerValue (1024)); ApplicationContainer clientApps = echoClient.Install (nodes.Get (0)); clientApps.Start (Seconds (2.0)); clientApps.Stop (Seconds (10.0)); - Install
FlowMonitoron all nodes to collect flow-level statistics. By doing so, at the end of the simulation, we can view and analyze each traffic flow’s throughput, delay, jitter, and packet loss:Ptr<FlowMonitor> flowmon; FlowMonitorHelper flowmonHelper; flowmon = flowmonHelper.InstallAll ();
- Enable packet capturing on all nodes. In doing so, at the end of the simulation, it is possible to view the
pcapfiles generated using thewiresharkortcpdumptools:pointToPoint.EnablePcapAll ("pkt_first"); - Configure the animation interface. By doing so, after completing the simulation execution, an animation XML file will be generated. The XML file can be viewed using NetAnim and visualizing the simulation execution:
AnimationInterface anim ("first_animation.xml"); anim.EnablePacketMetadata (); // Optional - Configure the stopping time of your simulation using
Simulator::Stop()and set its stop time value to be greater than the client and server applications’ stop timer values:Simulator::Stop (Seconds(11.0));
- Start running your simulation using
Simulator::Run():Simulator::Run ();
- Convert the flow monitor results into an XML file to parse and view it at the end of the simulation:
flowmon->SerializeToXmlFile ("first_flowmetrics.xml", true, true); - Clean up your simulation resources using
Simulator::Destroy():Simulator::Destroy ();
Let’s see the complete first simulation program (pkt_first.cc):
#include "ns3/core-module.h"
#include "ns3/network-module.h"
#include "ns3/internet-module.h"
#include "ns3/point-to-point-module.h"
#include "ns3/applications-module.h"
#include "ns3/netanim-module.h"
#include "ns3/flow-monitor-module.h"
using namespace ns3;
NS_LOG_COMPONENT_DEFINE ("FirstScriptExample");
int
main (int argc, char *argv[])
{
LogComponentEnable ("UdpEchoClientApplication", LOG_LEVEL_INFO);
LogComponentEnable ("UdpEchoServerApplication", LOG_LEVEL_INFO);
NodeContainer nodes;
nodes.Create (2);
PointToPointHelper pointToPoint;
pointToPoint.SetDeviceAttribute ("DataRate", StringValue ("1Gbps"));
pointToPoint.SetChannelAttribute ("Delay", StringValue ("1ms"));
NetDeviceContainer devices;
devices = pointToPoint.Install (nodes);
InternetStackHelper stack;
stack.Install (nodes);
Ipv4AddressHelper address;
address.SetBase ("192.168.1.0", "255.255.255.0");
Ipv4InterfaceContainer interfaces = address.Assign (devices);
uint64_t port = 9;
UdpEchoServerHelper echoServer (port);
ApplicationContainer serverApps = echoServer.Install (nodes.Get (1));
serverApps.Start (Seconds (1.0));
serverApps.Stop (Seconds (10.0));
UdpEchoClientHelper echoClient (interfaces.GetAddress (1), port);
echoClient.SetAttribute ("MaxPackets", UintegerValue (10));
echoClient.SetAttribute ("Interval", TimeValue (Seconds (0.1)));
echoClient.SetAttribute ("PacketSize", UintegerValue (1024));
ApplicationContainer clientApps = echoClient.Install (nodes.Get (0));
clientApps.Start (Seconds (2.0));
clientApps.Stop (Seconds (10.0));
  Ptr<FlowMonitor> flowmon;
  FlowMonitorHelper flowmonHelper;
  flowmon = flowmonHelper.InstallAll ();
pointToPoint.EnablePcapAll ("pkt_first");
  AnimationInterface anim ("first_animation.xml");
  anim.EnablePacketMetadata (); // Optional
Simulator::Stop (Seconds(11.0));
Simulator::Run ();
flowmon->SerializeToXmlFile ("first_flowmetrics.xml", true, true);
Simulator::Destroy ();
}
That’s great. We have completed our first simulation implementation. Let’s evaluate and analyze our first simulation thoroughly in the next section.
First simulation evaluation using ns-3
Let’s run our first simulation program using the following command. As pkt_first.cc is saved in the scratch folder, first move it to the ns-allinone-3.36/ns-3.36 folder and run the following command:
$./ns3 run scratch/pkt_first
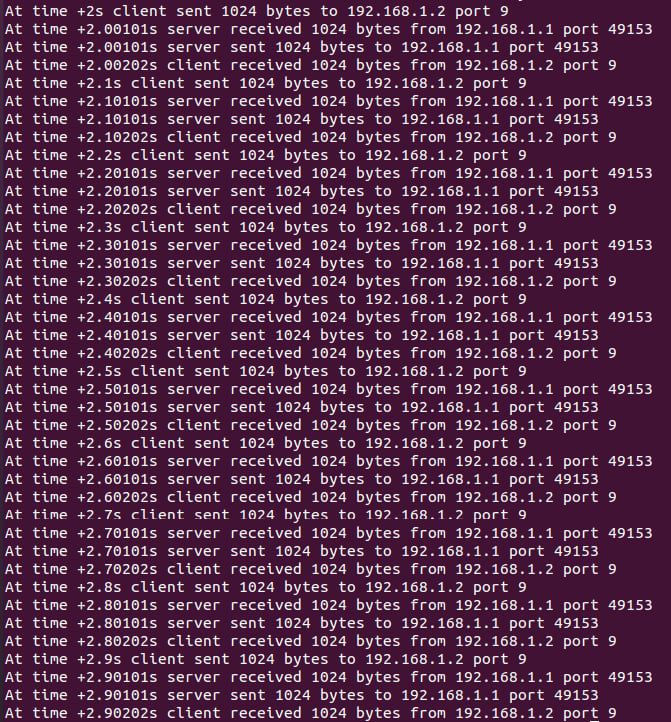
After executing the command, let’s observe the simulation results in Figure 1.12:

Figure 1.12 – The pkt_first.cc simulation execution results
After running the pkt_first.cc simulation, the following details need to be observed.
Monitor the simulation execution, including things such as how the two nodes exchange UDP echo requests and reply packets. Since we enabled the log components of the UDP echo server and client applications, it is possible to view the various events generated by the UDP applications used in our simulation. We can observe a few important details, such as at what time the first packet is generated by the client (at 2 seconds), at what time the server receives a packet and when it sends a reply for the packet, and the total number of packets exchanged between the client and server.
Check the list of files generated in Figure 1.13:

Figure 1.13 – The list of files generated at end of the simulation
We can observe a total of four files are generated at the end of the simulation.
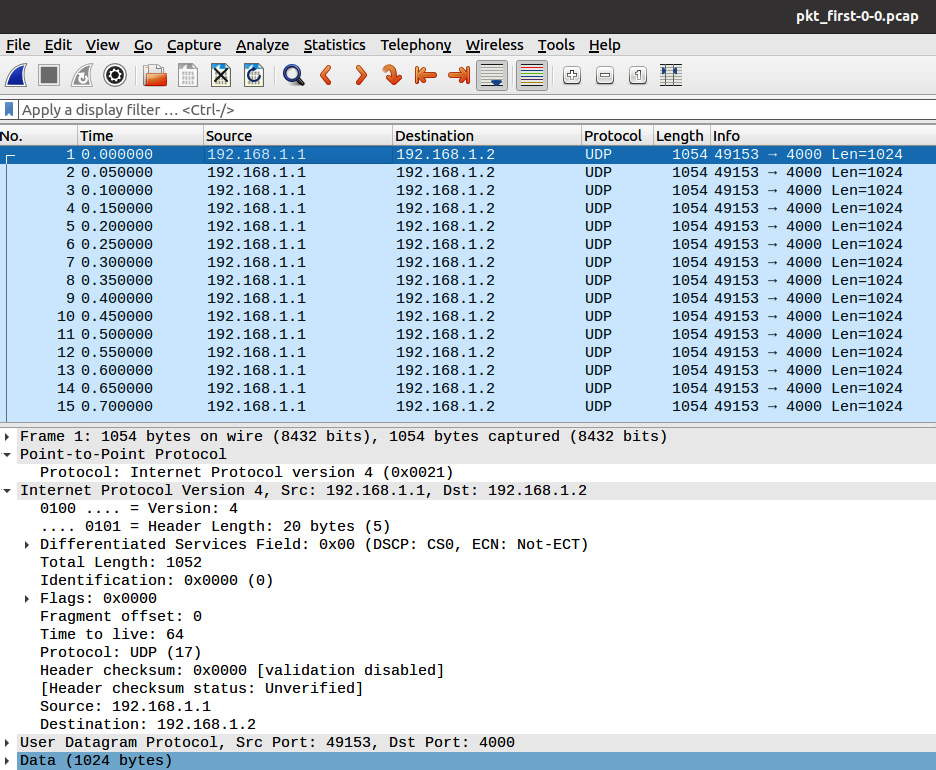
The first are PCAP files. As we are interested in viewing packets processed at Node 0 and 1, we enabled packet capturing on those nodes using pointToPoint.EnablePcapAll ("pkt_first"); in our simulation program. It generates two files whose names start with pkt_first followed by Node and its NIC numbers; for example, pkt_first_0_0.pcap corresponds to Node-0 and NIC-0, and pkt_first_1_0.pcap corresponds to Node-1 and NIC-0. We can open these .pcap files using wireshark (refer to Figure 1.14) or the tcpdump tool to view the file contents:

Figure 1.14 – The contents of pkt_first_0_0.pcap
Then we have two XML files. One file is first_animation.xml. This file can be used to visualize the simulation execution using the NetAnim tool. Another XML file is first_flowmetrics.xml. This file is useful for viewing flow statistics such as throughput, delay, jitter, and packet loss.
Let’s validate our simulation results with the ns-3 FlowMonitor using the following parsing commands.
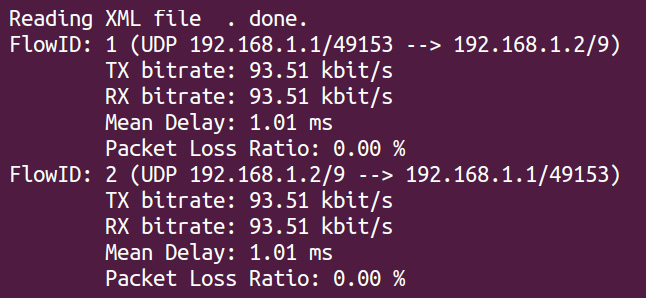
First copy ns-allinone-3.36/ns-3.36/src/flow-monitor/examples/flowmon-parse-results.py to the scratch folder. Execute the following command and observe the following results in Figure 1.15:
python3 scratch/flowmon-parse-results.py first_flowmetrics.xml
In our simulation, the UDP client application sends 10 packets of 1,024 bytes at a rate of one per second (10*1,024*8) to the echo server application. Hence, for both flows, we see the same TX and RX bitrates (93 kbps) in the flow monitor results shown in Figure 1.15. These results match our configured flow rate per second. Similarly, the average delay (1.01 ms) and packet loss (0%) can be verified:

Figure 1.15 – Flow monitor results
You can try changing MaxPackets, Interval, and PacketSize to observe different results.
The following are points to remember and check while implementing simulation programs:
- Check whether you imported all necessary packages.
- A few points to bear in mind while creating a topology are the following:
- The node index starts at 0.
- After connecting all nodes using channels, a node can have multiple network devices (or NICs). The NIC index also starts at 0.
- IP addresses should be assigned to nodes only after installing the necessary protocols and internet stack. From a subnet, the first IP will be assigned to the first node, the second IP assigned to the second node, and so on.
- Routing protocols should be configured on nodes only after IP address assignment.
- It is necessary to confirm on which nodes the client or server applications are installed and check whether the client is configured with the correct server’s socket address (server IP and port number). This helps avoid common mistakes in installing applications.
- Before running a simulation, it is also necessary to check application traffic characteristics such as the packet size, number of packets, packet intervals, and start and stop timings of respective client and server applications. This helps avoid common mistakes when computing flow-level metrics such as throughput, delay, jitter, and packet loss.
- It is good practice to install
FlowMonitorin your simulation setup to analyze your simulation results. When usingFlowMonitor, the following should be done:- It is necessary to use the
Simulator::Stop()statement beforeSimulator::Run()to break infinite events generated byFlowMonitor. - After the
Simulator:: Run()statement, it is necessary to useSerializeToXmlFile()to view results in the NetAnim visualizer.
- It is necessary to use the
- By default, logging, packet capturing, and tracing features are not enabled.
- In cases where users are interested in visualizing simulation results, it is necessary to write all suitable NetAnim statements in the program.
- Set the simulator stop time to a greater value than the client and server applications’ stop timer values.
In this section, we have learned how to write a simulation program using various ns-3 classes, and we also learned about important things to observe during and after a simulation execution. In the next section, we start the most fun and long-awaited ns-3 session using NetAnim.


