Toolbar
In this recipe, we are going to go over the ZAP Proxy toolbar and what each section of the toolbar does.
Getting ready
To review this recipe, you will need to have ZAP installed on your computer, and it should be started and running.
How to do it…
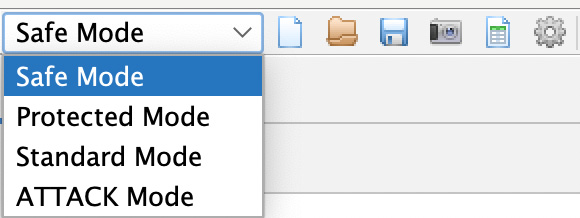
Looking at the toolbar from left to right, you will see the mode pulldown, as shown in Figure 2.3, which allows you to change modes in ZAP:
- Safe Mode will prevent you from performing any dangerous actions against a target.
- In Protected Mode, you will be able to perform dangerous actions against the application scope.
- Standard Mode is the mode in which you can do anything you want with no restriction from the tool.
- The last mode we have is ATTACK Mode. In this mode, you will start scanning for vulnerabilities with any new target added to the scope.

Figure 2.3 – The mode options on the top-level toolbar
The next four icons in Figure 2.3 are options that allow you to save, modify, and edit session information from a target.
The last icon in Figure 2.3, the cogwheel, allows you, the user, to change the settings of all the sections of ZAP proxy. This can also be accessed by going to Tools then Options. We will go into more detail later in the next chapters when we start changing and optimizing each section as we perform attacks.
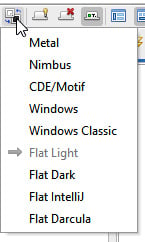
The next set of icons you find in Figure 2.4, from the top-level toolbar going left to right, allows you to change the ZAP proxy theme to eight different built-in templates:

Figure 2.4 – The middle of the top-level toolbar
The default setting is Flat Light, but you can switch to dark mode with Flat Dark, or use any other visual setting from the drop-down list, as shown in Figure 2.5. Keep in mind, any changes to the way that ZAP proxy looks may alter the locations of other settings within the tool. For this book, we are going to use the default settings throughout:

Figure 2.5 – Choosing a theme
As we continue, the next set of icons in the toolbar allows you to view all tabs (tab and lightbulb icon), hide unpinned tabs (tab with red X icon), and show tab icons and hide tab names (tab with a green square and the letter T).
Moving on to the right, the last seven icons allow you to change the ZAP proxy window layout, and they also allow you to expand either the Sites tree window, the Information window, or the Workspace window. For this book, we will be using the default configuration that expands the Information window along the bottom half of ZAP and keeps the Workspace window:

Figure 2.6 – The window layout
In the last section of the top-level toolbar (Figure 2.7), you will see the following:
- Settings (from left to right) that allow you to manage add-on plugins (red/blue/green blocks)
- Check for plugin updates (lightning bolt with blue arrow)
- Show/enable fields (lightbulb)
- Set and customize breakpoints (green/red circle, line/arrow, right arrow, stop sign and red X)
- Scan Policy Manager (control board)
- Apply forced user mode (padlock)
- Enable zest scripting (cassette tape)
- Open the user guide (blue question mark)
- Disable/enable the HUD (green radar)
- Use a preconfigured browser to proxy sites (Firefox logo)
- Report building (spiral notebook)
Each of these will be discussed in further detail in later chapters.

Figure 2.7 – The last section of the top-level toolbar
How it works…
The toolbar features the most common tools used in OWASP ZAP and is intended to help users with setting up and getting comfortable, accommodating different user preferences for testing with the tool. Spend time here getting to know and understand the options available to you.
See also
Open the Help menu and navigate to the OWASP ZAP user guide for more information.
Shortcut
Use F1 to quickly open the information guide.


