Search icon CANCEL
Subscription
0
Cart icon
Your Cart (0 item)
Close icon
You have no products in your basket yet
Save more on your purchases! discount-offer-chevron-icon
Savings automatically calculated. No voucher code required.
Arrow left icon
Explore Products
Best Sellers
New Releases
Books
Videos
Audiobooks
Learning Hub
Newsletter Hub
Free Learning
Arrow right icon
timer SALE ENDS IN
0 Days
:
00 Hours
:
00 Minutes
:
00 Seconds
Arrow up icon
GO TO TOP
Zabbix 4 Network Monitoring

You're reading from   Zabbix 4 Network Monitoring Monitor the performance of your network devices and applications using the all-new Zabbix 4.0

Arrow left icon
Product type Paperback
Published in Jan 2019
Publisher
ISBN-13 9781789340266
Length 798 pages
Edition 3rd Edition
Languages
Tools
Arrow right icon
Author (1):
Arrow left icon
Patrik Uytterhoeven Patrik Uytterhoeven
Author Profile Icon Patrik Uytterhoeven
Patrik Uytterhoeven
Arrow right icon
View More author details
Toc

Table of Contents (25) Chapters Close

Preface 1. Getting Started with Zabbix FREE CHAPTER 2. Getting Your First Notification 3. Monitoring with Zabbix Agents and Basic Protocols 4. Monitoring SNMP Devices 5. Managing Hosts, Users, and Permissions 6. Detecting Problems with Triggers 7. Acting upon Monitored Conditions 8. Simplifying Complex Configurations with Templates 9. Visualizing Data with Screens and Slideshows 10. Advanced Item Monitoring 11. Automating Configuration 12. Monitoring Web Pages 13. High-Level Business Service Monitoring 14. Monitoring IPMI Devices 15. Monitoring Java Applications 16. Monitoring VMware 17. Using Proxies to Monitor Remote Locations 18. Encrypting Zabbix Traffic 19. Working Closely with Data 20. Zabbix Maintenance 21. Troubleshooting 22. Being Part of the Community 23. Assessment 24. Other Books You May Enjoy

Zabbix features and architecture

Zabbix provides many ways of monitoring different aspects of your IT infrastructure and, indeed, almost anything you might want to hook up to it. It can be characterized as a semi-distributed monitoring system with centralized management. While many installations have a single central system, it is possible to use distributed monitoring with proxies, and most installations will use Zabbix agents.

What features does Zabbix provide? Let's have a look:

  • A centralized, easy to use web interface
  • A server that runs on most UNIX-like operating systems, including Linux, AIX, FreeBSD, OpenBSD, and Solaris
  • Native agents for most UNIX-like operating systems and Microsoft Windows versions
  • The ability to directly monitor SNMP (SNMPv1, SNMPv2c, and SNMPv3) and IPMI devices
  • The ability to directly monitor Java applications using JMX
  • The ability to directly monitor vCenter or vSphere instances using the VMware API
  • Built-in graphing and other visualization capabilities
  • Notifications that allow easy integration with other systems
  • Flexible configuration, including templating
  • Low-Level Discovery (LLD) and the ability to generate items, graphs, and triggers (among others) in an automated way
  • A lot of other features that allow you to implement a sophisticated monitoring solution

If we look at a simplified network from the Zabbix perspective, placing the Zabbix server at the center, the communication of the various monitoring aspects matters. The following diagram depicts a relatively simple Zabbix setup with several of the monitoring capabilities used and different device categories connected:

The Zabbix Server directly monitors multiple devices, but a remote location is separated by a firewall, so it is easier to gather data through a Zabbix proxy. The Zabbix proxy and Zabbix agents, just like the server, are written in the C language.

Our central object is the Zabbix database, which supports several backends. The Zabbix server, written in the C language, and the Zabbix web frontend, written in PHP, can both reside on the same machine or on another server. When running each component on a separate machine, both the Zabbix server and the Zabbix web frontend need access to the Zabbix database, and the Zabbix web frontend needs access to the Zabbix server to display the server status and for some additional functionality.

While it is perfectly fine to run all three server components on a single machine, there might be good reasons to separate them, such as taking advantage of an existing high-performance database or web server.

In general, monitored devices have little control over what is monitored—most of the configuration is centralized. Such an approach seriously reduces the ability of a single misconfigured system to bring down the whole monitoring setup.

In the following diagram, we have an overview of the basic Zabbix setup with our Zabbix server, web server and relational database. In our setup, we will install the three components on one machine. It is possible, however, to split up components over three different machines, something we will see later in this book:

Installation

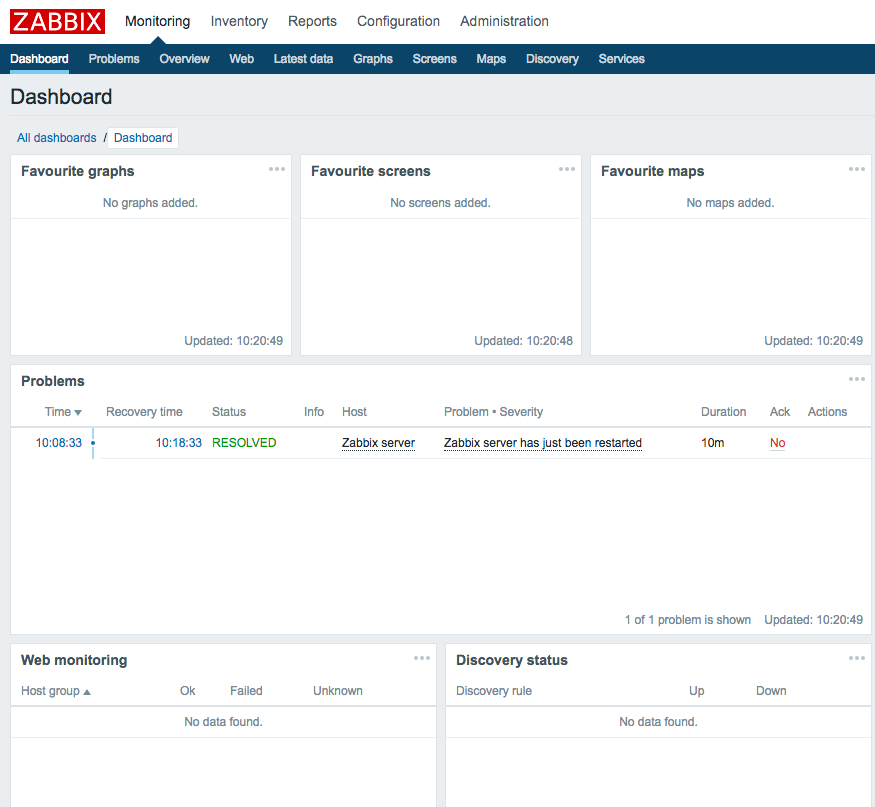
Alright, enough with the dry talk—what use is that? Let's look at the dashboard screen of the Zabbix web frontend, showing only a very basic standard configuration:

The Zabbix dashboard shows you a high-level overview of the overall status of the monitored system, the status of Zabbix, some of the most recent problems, and a few more things. This particular dashboard shows a very tiny Zabbix setup. Eventually, your Zabbix installation will grow and monitor different devices, including servers of various operating systems, different services and the hardware state on those servers, network devices, UPSes, web pages, other components of IT, and other infrastructure.

The frontend will provide various options for visualizing data, starting from lists of problems and simple graphs and ending with network maps and reports, while the backend will work hard to provide the information that this visualization is based on and send out alerts. All of this will require some configuration that we will learn to perform along the course of this book.

Before we can configure Zabbix, we need to install it. Usually, you'll have two choices—installing from packages or setting it up from the source code. Zabbix packages are available in quite a lot of Linux distribution repositories, and it is usually a safe choice to use those. Additionally, a Zabbix-specific repository is provided by SIA Zabbix (the company developing the product) for some distributions.

It is a good idea to check the latest installation instructions at https://www.zabbix.com/documentation/4.0/manual/installation.

Choosing the version and repository

At first, we will set up the Zabbix server, database, and frontend, all running on the same machine and using a MySQL database.

Should you use the packages or install from the source? In most cases, installing from the packages will be easier. Here are a few considerations that might help you select the method:

  • There are certain benefits of using distribution packages. These include the following:
    • Automated installation and updating
    • The dependencies are usually sorted out
    • Easy and proper cleanup when uninstalling
    • No installation of compilers needed on your systems
  • Compiling from source also has its share of benefits. They are as follows:
    • You can get newer versions with more features and improvements.
    • You have more fine-grained control over compiled-in functionality.

But which version to choose? You might see several versions available in repositories, and those versions might not be equal. Since Zabbix 2.2, the concept of a Long-Term Support (LTS) release has been introduced. This determines how long support in the form of bug fixes will be available for. An LTS release is supported for five years (three years full support and two years limited support), while a normal release is supported until a month after the release date of the next version. Zabbix 2.2 and 3.0 are LTS releases, while 2.4, 3.2, and 3.4 are normal releases. Choose an LTS release for an installation that you don't plan to upgrade for a setup where you want vendor (Zabbix SIA) support. A normal release can be used for a setup you intend to keep up-to-date. In this book, we will use the latest LTS release Zabbix version 4.0.

This policy might change. Verify the details on the Zabbix website: http://www.zabbix.com/life_cycle_and_release_policy.php.

The most widely used Zabbix architecture is a server that queries agents. This is what we will learn to set up initially so that we can monitor our test system.

As with most software, there are some prerequisites that we will need in order to run Zabbix components. These include requirements of hardware and other software that the Zabbix server and agent depend on. For the purpose of our installation, we will settle for running Zabbix on Linux, using a MySQL database. The specific Linux distribution does not matter much—it's best to choose the one you are most familiar with.

Hardware requirements

Hardware requirements vary wildly depending on the configuration. It is impossible to provide definite requirements, so any production installation should evaluate them individually. For our test environment, though, even as little RAM as 128 MB should be enough. CPU power in general won't play a huge role; Pentium II-class hardware should be perfectly capable of dealing with it, although generating graphs with many elements or other complex views could require more powerful hardware to operate at an acceptable speed. You can take these as a starting point as well when installing on a virtual machine.

Of course, the more resources you give to Zabbix, the snappier and happier it will be.

You have been reading a chapter from
Zabbix 4 Network Monitoring - Third Edition
Published in: Jan 2019
Publisher:
ISBN-13: 9781789340266
Register for a free Packt account to unlock a world of extra content!
A free Packt account unlocks extra newsletters, articles, discounted offers, and much more. Start advancing your knowledge today.
Unlock this book and the full library FREE for 7 days
Get unlimited access to 7000+ expert-authored eBooks and videos courses covering every tech area you can think of
Renews at $19.99/month. Cancel anytime
Banner background image