Search icon CANCEL
Subscription
0
Cart icon
Your Cart (0 item)
Close icon
You have no products in your basket yet
Arrow left icon
Explore Products
Best Sellers
New Releases
Books
Videos
Audiobooks
Learning Hub
Conferences
Free Learning
Arrow right icon
Arrow up icon
GO TO TOP
VMware Performance and Capacity Management, Second Edition

You're reading from   VMware Performance and Capacity Management, Second Edition Master SDDC Operations with proven best practices

Arrow left icon
Product type Paperback
Published in Mar 2016
Publisher
ISBN-13 9781785880315
Length 546 pages
Edition 2nd Edition
Tools
Arrow right icon
Authors (2):
Arrow left icon
Sunny Dua Sunny Dua
Author Profile Icon Sunny Dua
Sunny Dua
Iwan 'e1' Rahabok Iwan 'e1' Rahabok
Author Profile Icon Iwan 'e1' Rahabok
Iwan 'e1' Rahabok
Arrow right icon
View More author details
Toc

Table of Contents (20) Chapters Close

Preface Part 1 FREE CHAPTER
1. VM – It Is Not What You Think! 2. Software-Defined Data Centers 3. SDDC Management 4. Performance Monitoring 5. Capacity Monitoring Part 2
6. Performance-Monitoring Dashboards 7. Capacity-Monitoring Dashboards 8. Specific-Purpose Dashboards 9. Infrastructure Monitoring Using Blue Medora 10. Application Monitoring Using Blue Medora Part 3
11. SDDC Key Counters 12. CPU Counters 13. Memory Counters 14. Storage Counters 15. Network Counters Index

Network counters at the Guest OS level

Understanding network counters at the Guest OS level is important for an SDDC architect. The data inside the Guest provides better visibility.

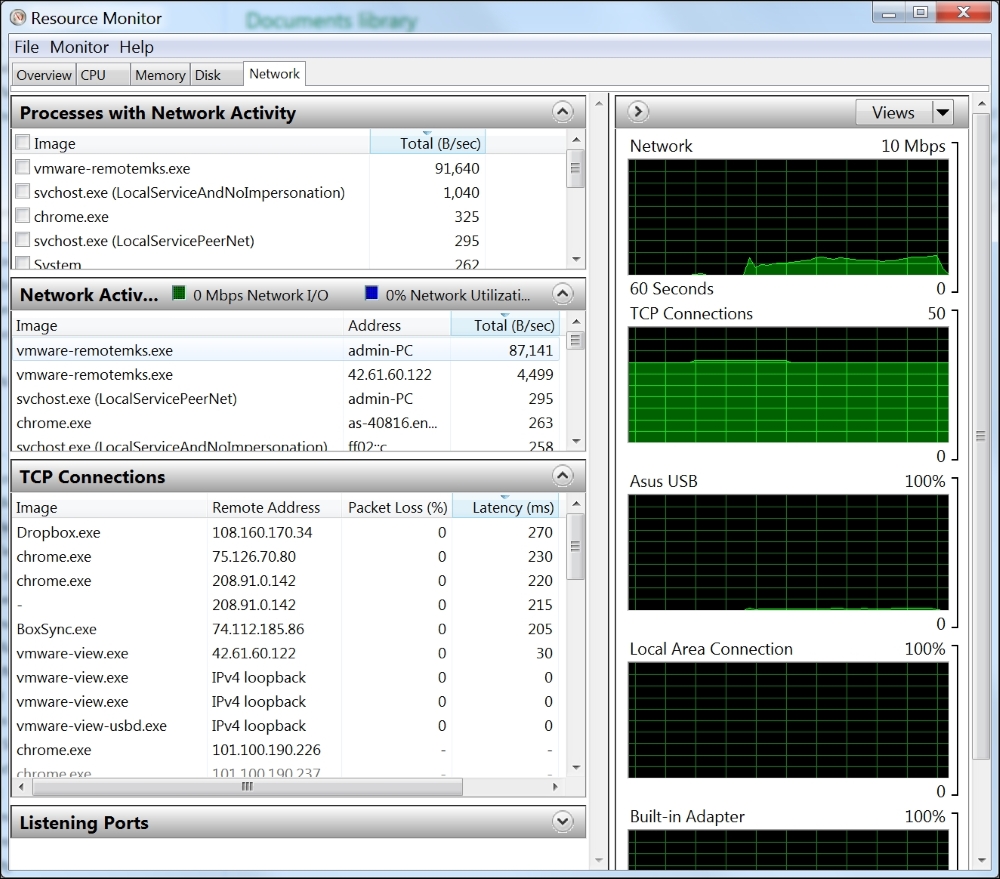
The following screenshot shows Windows 7 Resource Monitor. You will quickly notice that a lot of this information is not available at the vSphere layer:
Network counters at the Guest OS level

Windows 7 Resource Monitor

At the hypervisor layer, we can only see packet loss. Can you notice a counter that will tell you whether there is a network issue even if there is no packet loss?

Yes: latency.

It is in fact available at the process level. This is important as different processes can be talking to different destinations. It is in fact normal for a web browser to hit multiple sites. As you can see here, a single browser (Google Chrome) is talking to different websites.

In the preceding screenshot, the Windows 7 PC was playing an HD video over VMware Horizon View. Latency was good at below 50 milliseconds, and View PCoIP was using less than 100 KBPS of bandwidth...

lock icon The rest of the chapter is locked
Register for a free Packt account to unlock a world of extra content!
A free Packt account unlocks extra newsletters, articles, discounted offers, and much more. Start advancing your knowledge today.
Unlock this book and the full library FREE for 7 days
Get unlimited access to 7000+ expert-authored eBooks and videos courses covering every tech area you can think of
Renews at $19.99/month. Cancel anytime
Banner background image