Remote debugging
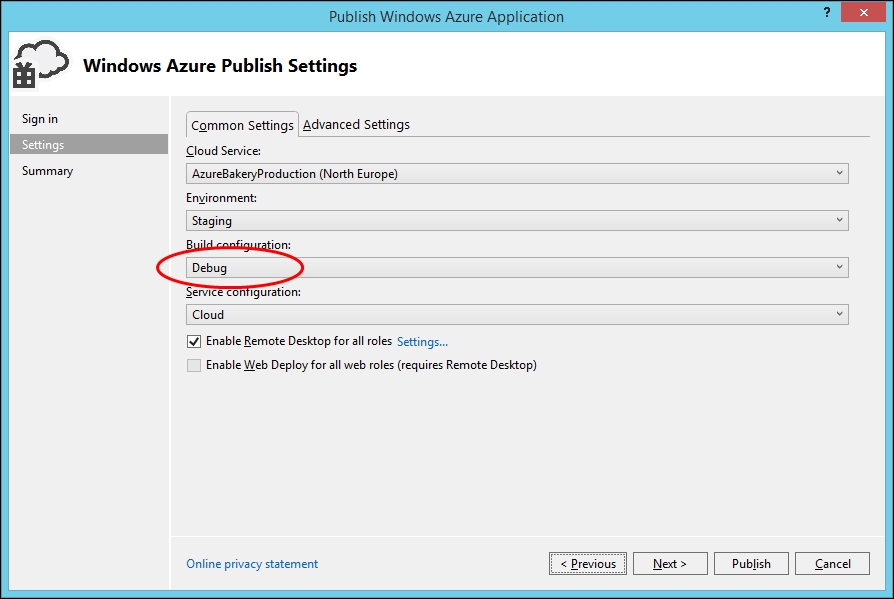
Worker roles support remote debugging, which is a really useful feature to help you debug a system deployed to the cloud. To get started with this, we need to publish our role in the Debug configuration so that we can successfully attach the debugger to it:

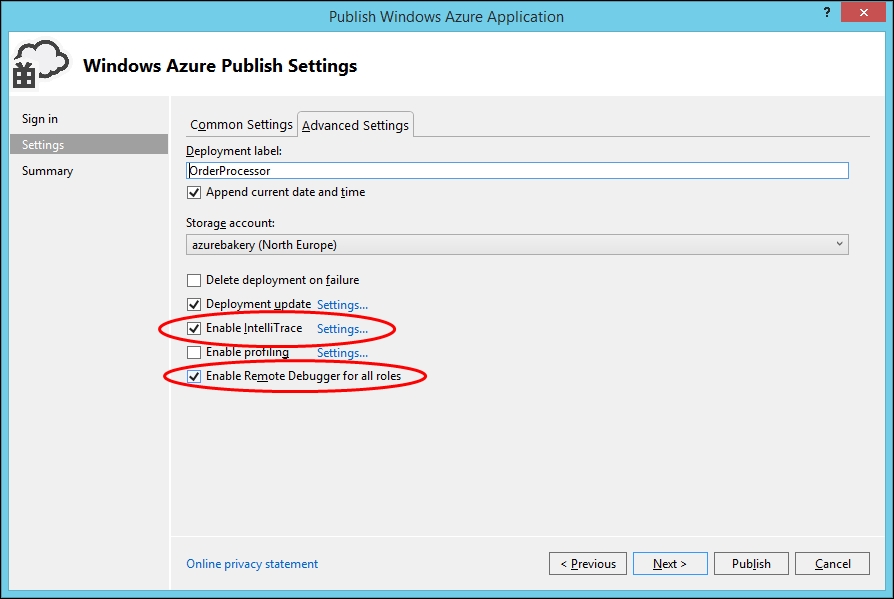
In the Advanced Settings tab, check Enable Remote Debugger for all roles. I've also checked Enable IntelliTrace, so we can look at this too:

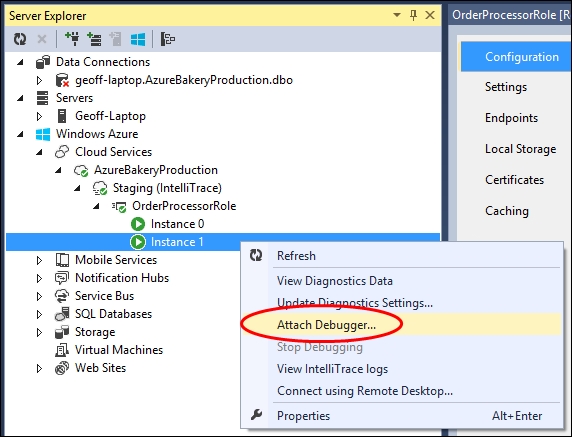
We can debug an entire role or an individual instance from the Visual Studio Server Explorer window. If we choose to debug an entire role, the debugger will break on the first instance to run into the break point; debugging multiple instances is similar to debugging multithreaded applications, which can sometimes be a little confusing, so if you're not debugging a concurrency issue, it's probably easier to debug a single instance.
To start debugging in Visual Studio from the Server Explorer window, choose a role or an instance, right-click on it, and select Attach Debugger...:

Next,...


