Search icon CANCEL
Subscription
0
Cart icon
Your Cart (0 item)
Close icon
You have no products in your basket yet
Save more on your purchases! discount-offer-chevron-icon
Savings automatically calculated. No voucher code required.
Arrow left icon
Explore Products
Best Sellers
New Releases
Books
Videos
Audiobooks
Learning Hub
Newsletter Hub
Free Learning
Arrow right icon
timer SALE ENDS IN
0 Days
:
00 Hours
:
00 Minutes
:
00 Seconds
Arrow up icon
GO TO TOP
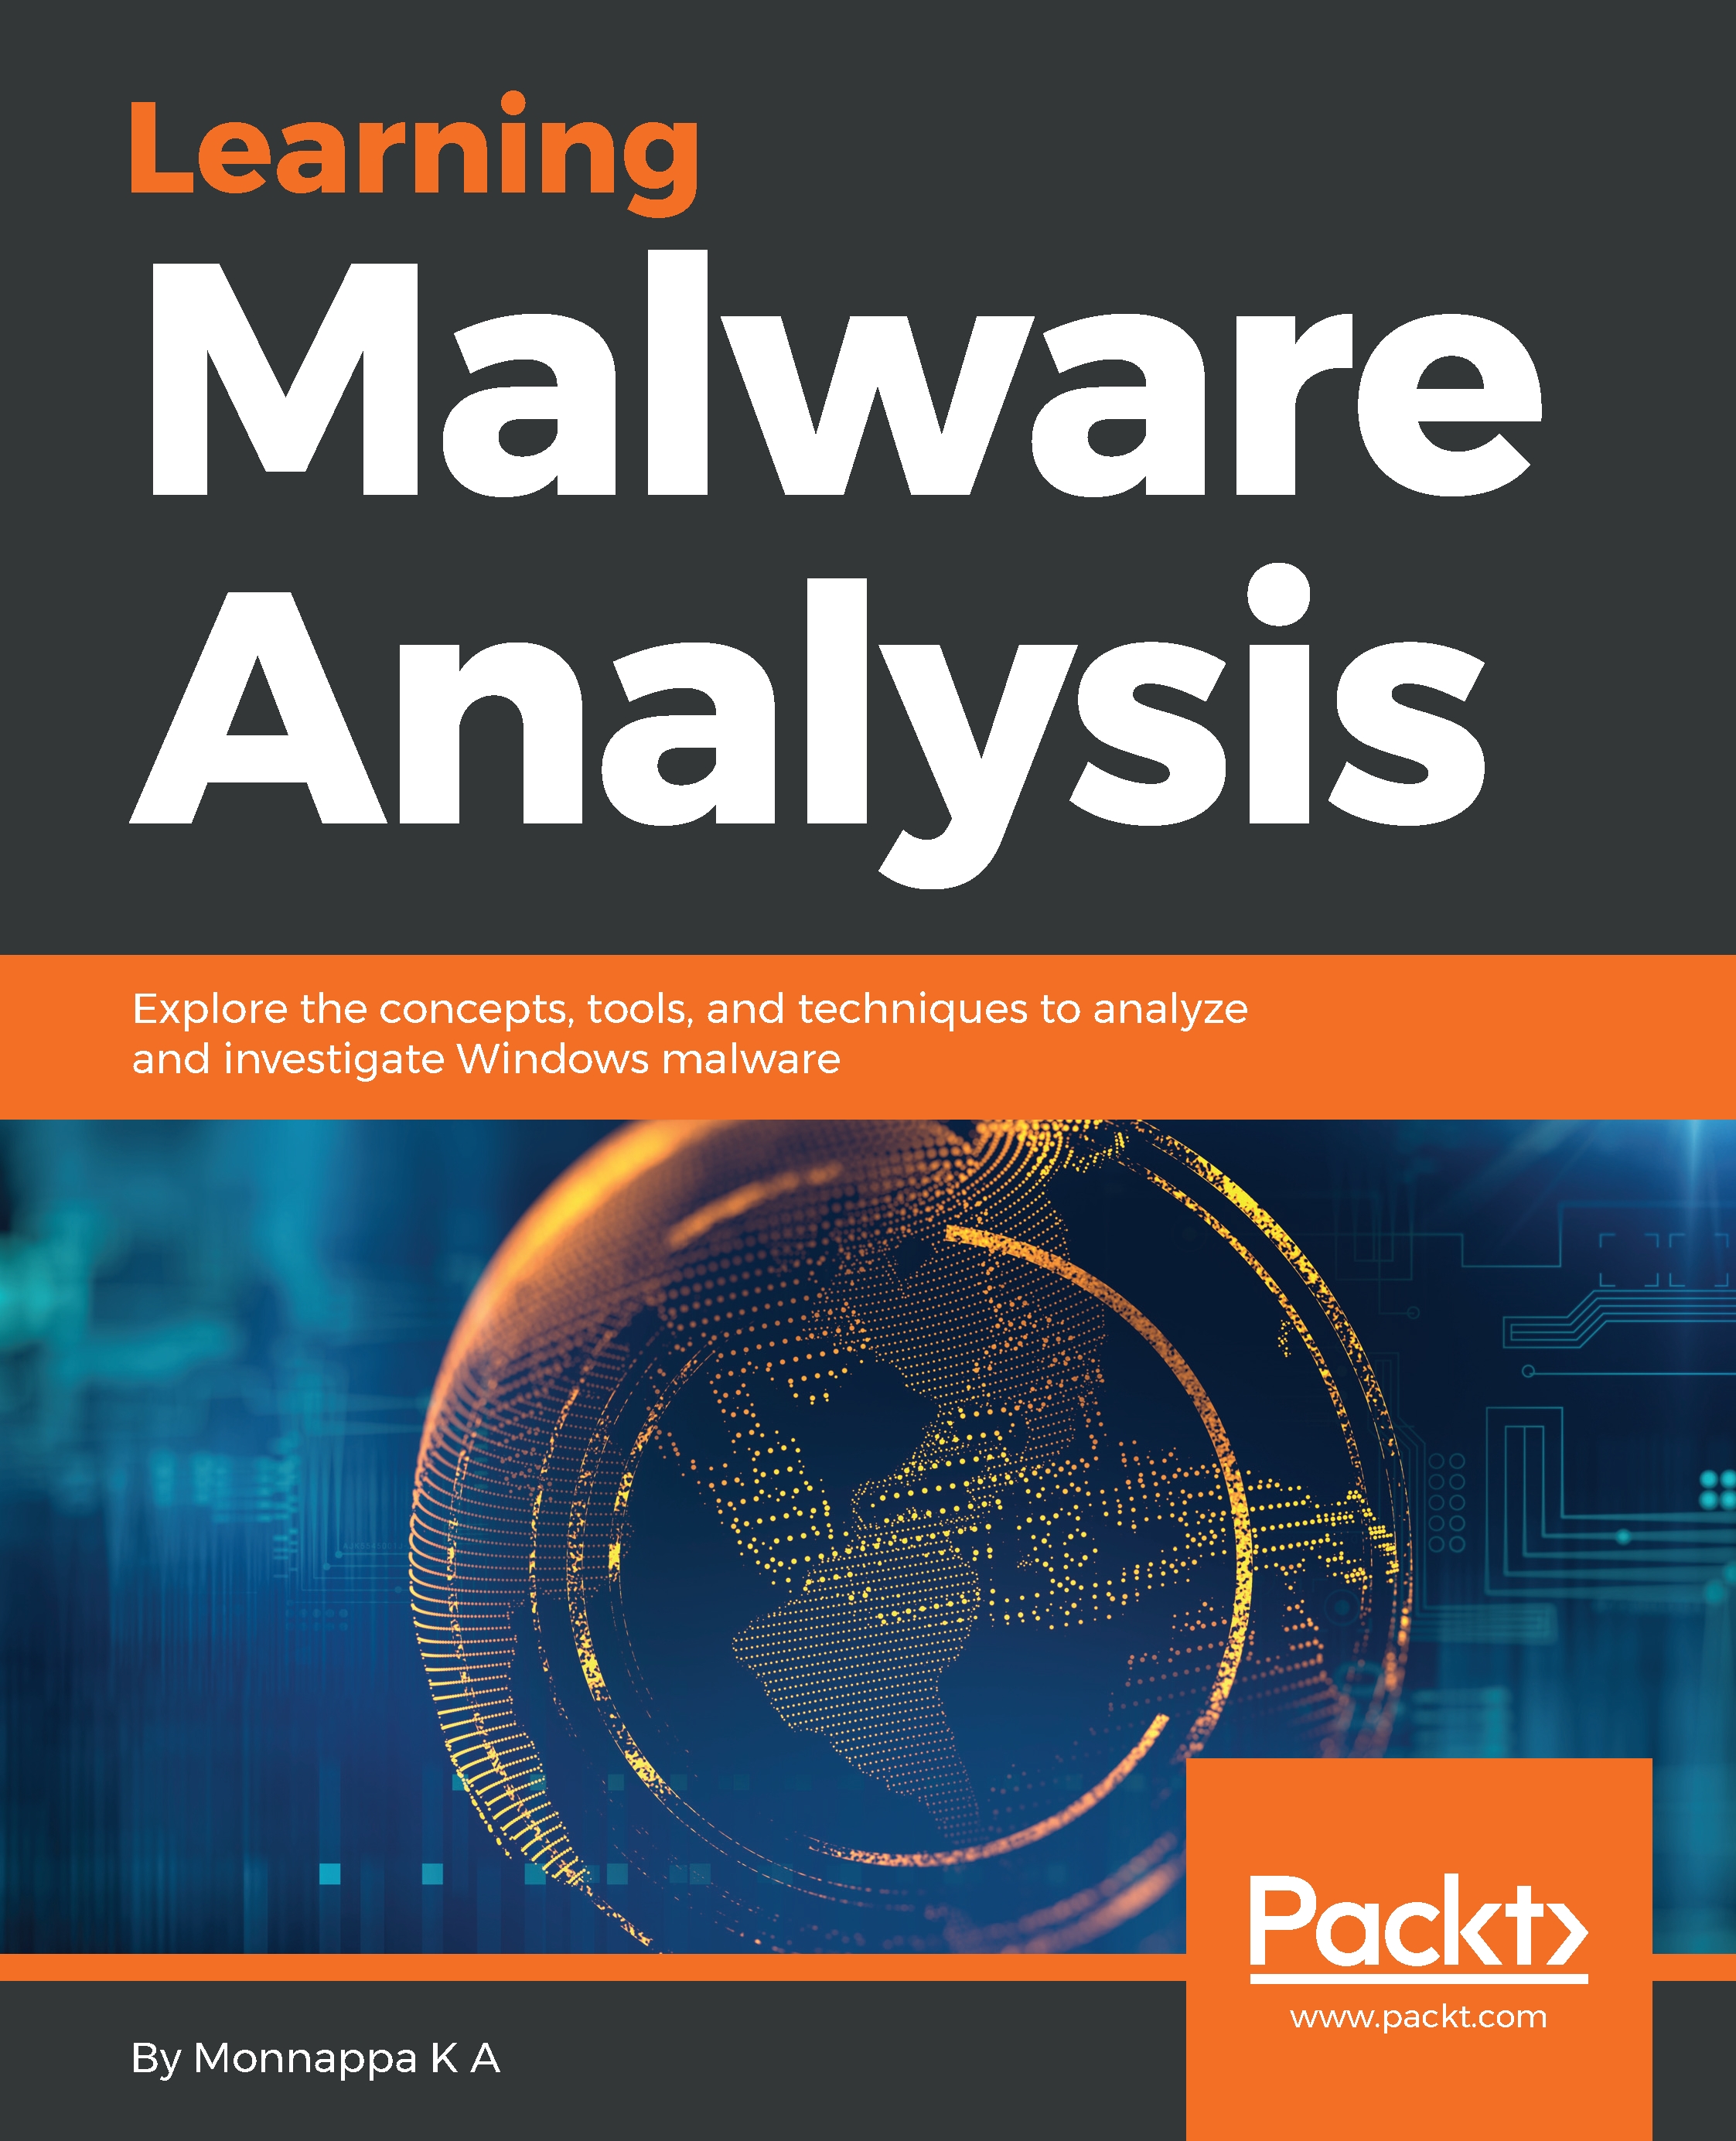
Learning Malware Analysis

You're reading from   Learning Malware Analysis Explore the concepts, tools, and techniques to analyze and investigate Windows malware

Arrow left icon
Product type Paperback
Published in Jun 2018
Publisher
ISBN-13 9781788392501
Length 510 pages
Edition 1st Edition
Arrow right icon
Author (1):
Arrow left icon
Monnappa K A Monnappa K A
Author Profile Icon Monnappa K A
Monnappa K A
Arrow right icon
View More author details
Toc

Table of Contents (13) Chapters Close

Preface 1. Introduction to Malware Analysis FREE CHAPTER 2. Static Analysis 3. Dynamic Analysis 4. Assembly Language and Disassembly Primer 5. Disassembly Using IDA 6. Debugging Malicious Binaries 7. Malware Functionalities and Persistence 8. Code Injection and Hooking 9. Malware Obfuscation Techniques 10. Hunting Malware Using Memory Forensics 11. Detecting Advanced Malware Using Memory Forensics 12. Other Books You May Enjoy

1. General Debugging Concepts


Before we delve into the features offered by these debuggers (IDA Pro, x64dbg, and DnSpy), It is essential to understand some of the common features that most debuggers provide. In this section, you will mainly see the general debugging concepts; in the subsequent sections, we will focus on the essential features of IDA Pro, x64dbg, and dnSpy.

1.1 Launching And Attaching To Process

Debugging normally begins by selecting the program to debug. There are two ways to debug a program: (a) attach the debugger to a running process, and (b) launch a new process. When you attach the debugger to a running process, you will not be able to control or monitor the process's initial actions, because by the time you have a chance to attach to the process, all of its startup and initialization code will have already been executed. When you attach the debugger to a process, the debugger suspends the process, giving you a chance to inspect the process's resources or set a breakpoint...

lock icon The rest of the chapter is locked
Register for a free Packt account to unlock a world of extra content!
A free Packt account unlocks extra newsletters, articles, discounted offers, and much more. Start advancing your knowledge today.
Unlock this book and the full library FREE for 7 days
Get unlimited access to 7000+ expert-authored eBooks and videos courses covering every tech area you can think of
Renews at $19.99/month. Cancel anytime
Banner background image