Using Optimus
Now that we have Optimus installed, we can start using it. In this section, we'll run through some of the main features and how to use them.
The Optimus instance
You use the Optimus instance to configure the engine, as well as load and save data. Let's see how this works.
Once Optimus has been installed on your system, you can use it in a Python environment. Let's import the Optimus class and instantiate an object of it:
from optimus import Optimus
op = Optimus(engine=pandas)
In Optimus, we call a DataFrame technology an engine. In the preceding example, we're setting up Optimus using Pandas as the base engine. Very easy!
Now, let's instantiate Optimus using Dask in a remote cluster. For this, we'll have to pass the configuration in the arguments to the Optimus function – specifically, the session argument – which allows us to pass a Dask client:
from dask.distributed import Client
client = Client("127.0.0.105")
op = Optimus(engine="dask", session=client)
In the preceding code, we instantiated a Dask distributed client and passed it to the Optimus initialization.
To initialize with a different number of workers, you can pass a named argument as well:
op = Optimus(engine="dask", n_workers=2)
This will create a local client automatically, instead of passing just one, as in the previous example.
Using Dask, you can now access more than 100 functions to transform strings, as well as filter and merge data.
Saving and loading data from any source
Using the Optimus instance, you can easily load DataFrames from files or databases. To load a file, simply call one of the available methods for different formats (.csv, .parquet, .xlsx, and more) or simply the generic file method, which will infer the file format and other parameters:
op.load.csv("path/to/file.csv")
op.load.file("path/to/file.csv")
For databases or external buckets, Optimus can handle connections as different instances, which allows us to maintain operations and clean any credentials and addresses that may or may not repeat on different loading routines:
db = op.connect.database( *db_args )
op.load.database_table("table name", connection=db)
conn = op.connect.s3( *s3_args )
op.load.file("relative/path/to/file.csv", connection=conn)
On the other hand, to save to a file or to the table of a database, you can use the following code:
df.save.csv("relative/path/to/file.csv", connection=conn)
df.save.database_table("table_name", db=db)
Now that we have started our engine and have our data ready, let's see how we can process it using the Optimus DataFrame.
The Optimus DataFrame
One of the main goals of Optimus is to try and provide an understandable, easy-to-remember API, along with all the tools needed to clean and shape your data. In this section, we are going to highlight the main features that separate Optimus from the available DataFrame technologies.
Using accessors
Optimus DataFrames are made to be modified in a natural language, dividing the different methods available into components. For example, if we want to modify a whole column, we may use the methods available in the .cols accessor, while if we want to filter rows by the value of a specific column, we may use a method in the .rows accessor, and so on.
An example of an operation could be column renaming:
df.cols.rename("function", "job")
In this case, we are simply renaming the function column to "job", but the modified DataFrame is not saved anywhere, so the right way to do this is like so:
df = df.cols.rename("function", "job")
In addition, most operations return a modified version of the DataFrame so that those methods can be called, chaining them:
df = df.cols.upper("name").cols.lower("job")
When Optimus instantiates a DataFrame, it makes an abstraction of the core DataFrame that was made using the selected engine. There is a DataFrame class for every engine that's supported. For example, a Dask DataFrame is saved in a class called DaskDataFrame that contains all the implementations from Optimus. Details about the internals of this will be addressed later in this book.
As we mentioned previously, to use most of these methods on an Optimus DataFrame, it's necessary to use accessors, which separate different methods that may have distinct behaviors, depending on where they're called:
df.cols.drop("name")
The preceding code will drop the entire "name" column. The following command returns a different DataFrame:
df.rows.drop(df["name"]==MEGATRON)
The preceding code will drop the rows with values in the "name" column that match the MEGATRON value.
Obtaining richer DataFrame data
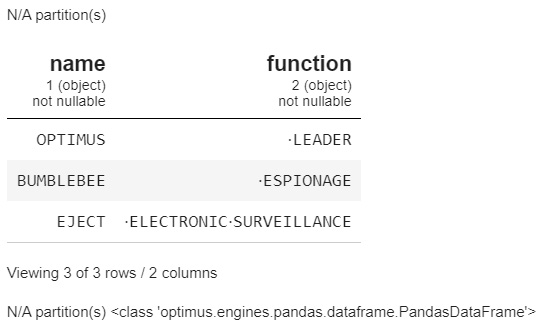
Optimus aims to give the user important information when needed. Commonly, you will use head() or show() to print DataFrame information. Optimus can provide additional useful information when you use display:
df.display()
This produces the following output:

Figure 1.8 – Optimus DataFrame display example
In the previous screenshot, we can see information about the requested DataFrame, such as the number of columns and rows, all the columns, along with their respective data types, some values, as well as the number of partitions and the type of the queried DataFrame (in this case, a DaskDataFrame). This information is useful when you're transforming data to make sure you are on the right track.
Automatic casting when operating
Optimus will cast the data type of a column based on the operation you apply. For example, to calculate min and max values, Optimus will convert the column into a float and ignore non-numeric data:
dfn = op.create.dataframe({"A":["1",2,"4","!",None]})
dfn.cols.min("A"), df.cols.max("A")
(1.0, 4.0)
In the preceding example, Optimus ignores the "!" and None values and only returns the lower and higher numeric values, respectively, which in this case are 1.0 and 4.0.
Managing output columns
For most column methods, we can choose to make a copy of every input column and save it to another so that the operation does not modify the original column. For example, to save an uppercase copy of a string type column, we just need to call the same df.cols.upper with an extra argument called output_cols:
df.cols.capitalize("name", output_cols="cap_name")
This parameter is called output_cols and is plural because it supports multiple names when multiple input columns are passed to the method:
df.cols.upper(["a", "b"],
              output_cols=["upper_a", "upper_b"])
In the preceding example, we doubled the number of columns in the resulting DataFrame, one pair untouched and another pair with its values transformed into uppercase.
Profiling
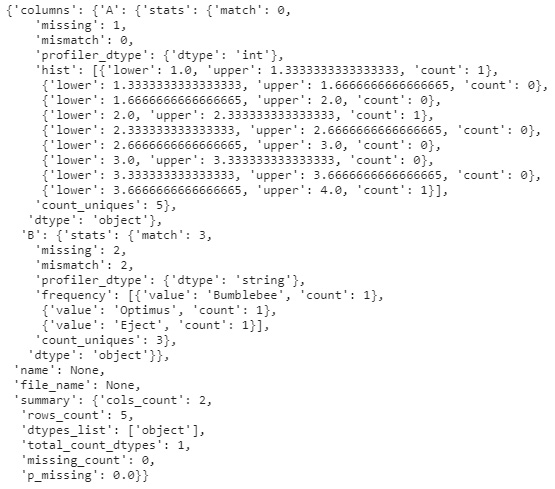
To get an insight into the data being transformed by Optimus, we can use df.profile(), which provides useful information in the form of a Python dictionary:
df = op.create.dataframe({"A":["1",2,"4","!",None],
                          "B":["Optimus","Bumblebee",
                               "Eject", None, None]})
df.profile(bins=10)
This produces the following output:

Figure 1.9 – Profiler output
In the preceding screenshot, we can see data, such as every column, along with its name, missing values, and mismatch values, its inferred data type, its internal data type, a histogram (or values by frequency in categorical columns), and unique values. For the DataFrame, we have the name of the DataFrame, the name of the file (if the data comes from one), how many columns and rows we have, the total count of data types, how many missing rows we have, and the percentage of values that are missing.
Visualization
One of the most useful features of Optimus is its ability to plot DataFrames in a variety of visual forms, including the following:
- Frequency charts
- Histograms
- Boxplots
- Scatterplots
To achieve this, Optimus uses Matplotlib and Seaborn, but you can also get the necessary data in Python Dictionary format to use with any other plotting library or service.
Python Dictionary output
By default, every output operation in Optimus will get us a dictionary (except for some cases, such as aggregations, which get us another DataFrame by default). Dictionaries can easily be transformed and saved into a JSON file, in case they are needed for a report or to provide data to an API:
df.columns_sample("*")
String, numeric, and encoding tools
Optimus tries to provide out-of-the-box tools to process strings and numbers, and gives you tools for the data preparation process so that you can create machine learning models.
String clustering
String clustering refers to the operation of grouping different values that might be alternative representations of the same thing. A good example of this are the strings "NYC" and "New York City". In this case, they refer to the same thing.
Processing outliers
Finding outliers is one of the most common applications for statistical DataFrames. When finding outliers, there are various possible methods that will get us different results, such as z-score, fingerprint, n-gram fingerprint, and more. With Optimus, these methods are provided as alternatives so that you can adapt to most cases.
Encoding techniques
Encoding is useful for machine learning models since they require all the data going out or coming in to be numeric. In Optimus, we have methods such as string_to_index, which allows us to transform categorical data into numerical data.
Technical details
When dealing with distributed DataFrame technologies, there are two concepts that arise that are an integral part of how Optimus is designed. These are lazy and eager execution.
Let's explore how this works in Optimus.
Distributed engines process data in a lazy way
In Dask, for example, when you apply a function to a DataFrame, it is not applied immediately like it would be in pandas. You need to trigger this computation explicitly, by calling df.execute(), or implicitly, when calling other operations that trigger this processing.
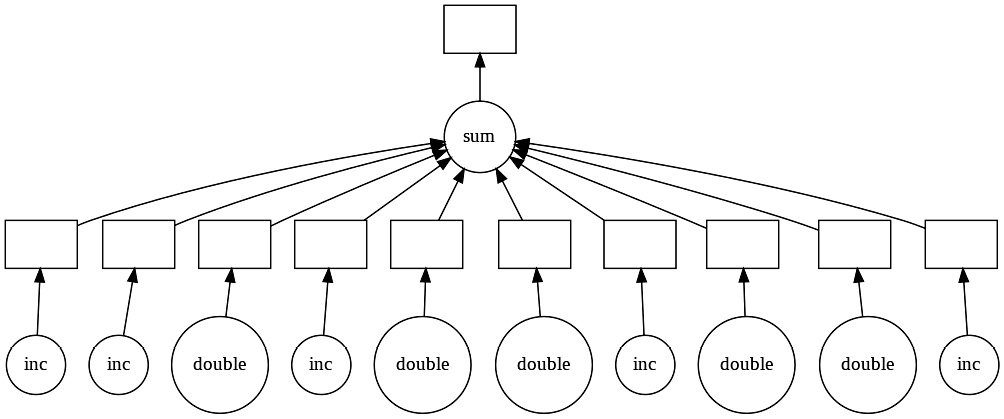
Optimus makes use of this functionality to trigger all the computation when explicitly requested. For example, when we request the profile of a dataset, every operation, such as histogram calculation, top-n values, and data types inference, is pushed to a cluster in a directed acyclic graph (DAG) and executed in parallel.
The following representation shows multiple operations being executed in parallel being visualized in a DAG:

Figure 1.10 – Visualizing a DAG in Dask
Aggregations return computed operations (eager execution)
As we mentioned earlier, distributed engines process aggregations in a lazy way. Optimus triggers aggregation so that you can always visualize the result immediately.
Triggering an execution
Optimus is capable of immediately executing an operation if requested. This only applies to engines that support delayed operations, such as Dask and PySpark. This way, we reduce the computation time when you know some operations will change on your workflow:
df = df.cols.replace("address", "MARS PLANET",
                     "mars").execute()
In the preceding example, we're replacing every match with "MARS PLANET" on the address column with "mars" and then saving a cache of this operation.
However, there are some operations or methods that will also trigger all the delayed operations that were made previously. Let's look at some of these cases:
- Requesting a sample: For example, calling
df.display()after any delayed function will require the final data to be calculated. For this reason, Optimus will trigger all the delayed operations before requesting any kind of output; this will also happen when we call any other output function. - Requesting a profile: When calling
df.profile(), some aggregations are done in the background, such as counting for unique, mismatched, and missing values. Also, getting the frequent values or the histogram calculation of every column will require a delayed function to have been executed previously.
When using a distributed DataFrame technology, when an operation is executed, the data is executed and stored in every worker. In the case of Dask, this function would be cache, which is called when we call execute on our Optimus DataFrame. Note that if we call compute directly on a Dask DataFrame instead, all the data will be brought to the client, which might cause memory issues in our system if the data is too big.


