Creating model calculations
The sales model that has been developed in this chapter allows the user to interrogate data from the order list by products, customers, and dates. In doing so, the user can create an implicit measure so that the underlying data is aggregated according to the current filter context. The aggregation function of implicit measures is determined by the underlying data type of the column that is used for the measure. This method offers the user the ability to create and show simple calculations from the model data. However, it does not create a robust model because the calculations aren't readily selectable by the user and the calculation definition is not conformed within the model.
This recipe introduces calculations which are contained within the model and presented to the user as measures. DAX (the tabular model language introduced in Adding fields to tables recipe) is used to define measures, so that it can explicitly use these measures in the model. Furthermore, the ability to create measures through a complex DAX allows the model designer a larger degree of flexibility than is involved with implicit measures.
Getting ready
This recipe assumes that the sales model created in Linking fields between tables recipe is available and that the appropriate relationships exist among the Product, Subcategory, and Category tables.
By default, a table in Data View will have a horizontal line that does not show any data. This is referred to as the calculation area. If this is not visible, ensure that the Calculation Area button is selected in the Home menu.

How to do it…
There are many ways to create simple measures. Let's start with the automatic creation of measures.
- Select any cell in the
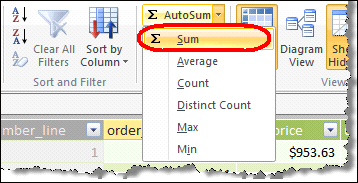
order_quantityfield. Then, from the ribbon, select the SUM function from the AutoSum drop-down. A new calculation will be created in the calculation area as:Sum of order_quantity:=SUM([order_quantity])
- In the formula bar, select the name of the measure (
Sum of order_quantity) and rename it toTotal Order Quantity. The calculation should now look like this:Total Order Quantity:=SUM([order_quantity])

- Right-click on the calculation, select Format Cells... from the pop-up menu, and specify the format as a number format—(decimal number) with zero decimal places and click on the User 1000 separator (,) checkbox.
- Select this group of columns:
unit_cost,tax,total_price, andtotal_profit, by selecting theunit_costcolumn and dragging the mouse across to thetotal_profitcolumn. - Click on the AutoSum button to create your calculations for these columns.
- Rename the measures to
Total Cost,Total Tax,Total Price, andTotal Profitrespectively with the same format asTotal Order Quantity. Note that the format of the number is inherited as currency. - Select the cell in the calculation area under the
unit_pricecolumn and type the formula:Average Price:=AVERAGE([unit_price])
Intellisence provides a list of formulas available (based on the expression that is entered) and a description of the function, as shown in the following screenshot:

- Hide the following fields of the
Salestable:order_quantity,unit_price,tax,total_price, andtotal_profit. - Return to the PowerPivot Field List pane (in Excel) and refresh the model. Existing implicit calculations that were based on existing fields are removed from the model and the
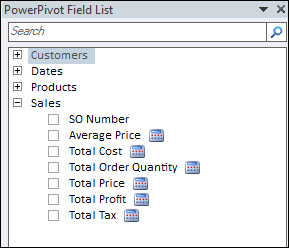
Salestable now includes the additional measures which were created. These measures can now be placed in the pivot tables (value) field list.Tip
Explicit measure cannot be used in a slicer, filter, or as row or column labels.

How it works…
Measures that are created in the calculation area operate in the same manner as implicit measures. That is, the aggregation function is applied to the filtered data specified by the row and filter context within the client tool.
Because the measures are explicitly defined in the model they are called explicit measures and interpreted by the client tool as measures (many client tools detect an explicit measure as a special type of field and treat it differently than a table's standard field or dimension field).
There's more...
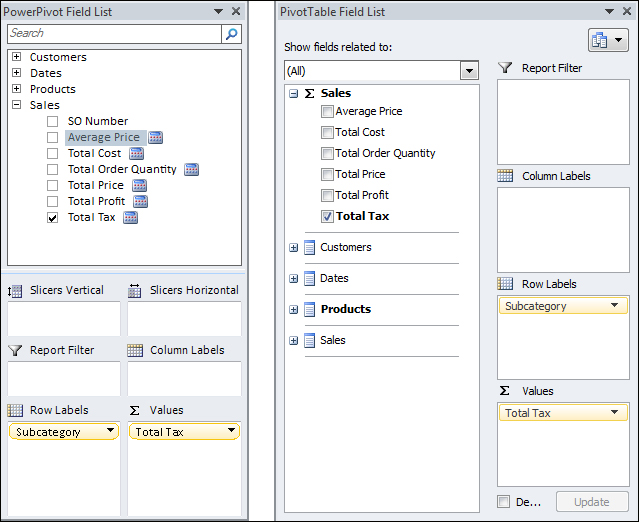
By default, the tabular model created in PowerPivot will display the model through a PowerPivot pivot table. This shows the model in its tabular form where measures and columns are shown with respect to the tables that they relate to. For example, the measures created in the Creating model calculations recipe appear under the Sales table node. In order to compare this (tabular) view with that of a traditional OLAP client, simply do the following:
- Ensure that a cell within the pivot table is selected.
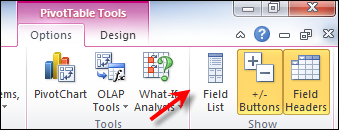
- Activate PivotTable Field List by clicking on the Field List button from the Options tab of the PivotTable Tools menu.

- The PivotTable Field List window opens, which shows the tabular model in the multidimensional (client) format.

The client tool (PivotTable Field List) shows the model in a different format and represents how a client tool interpretation of the model would be shown. Here, the measures are shown in measure groups and are not included as table objects.


