Configuring debugging with VS Code
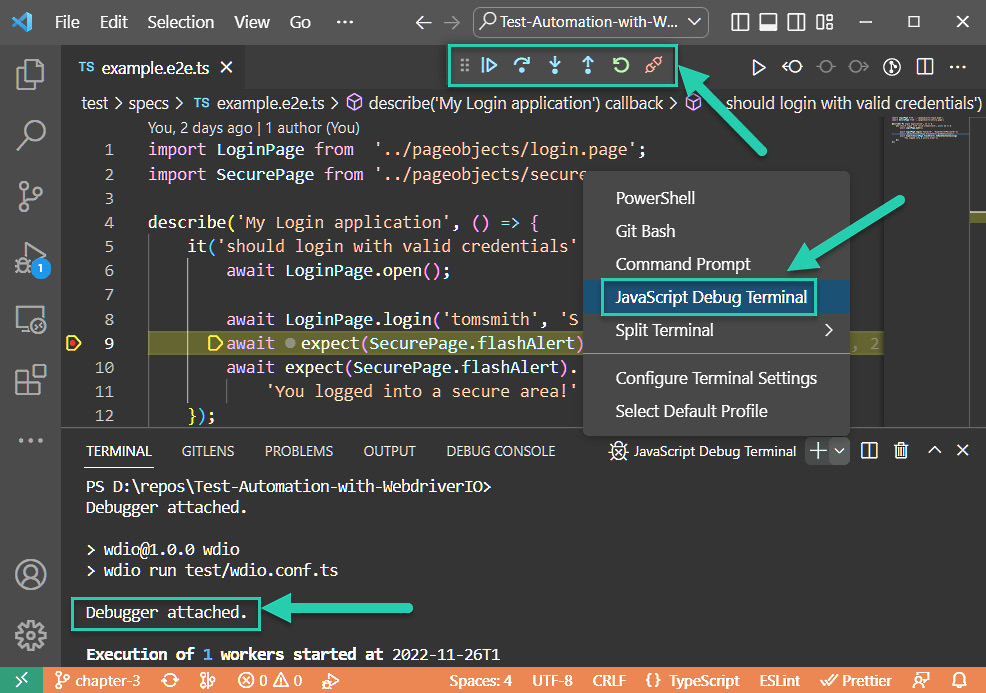
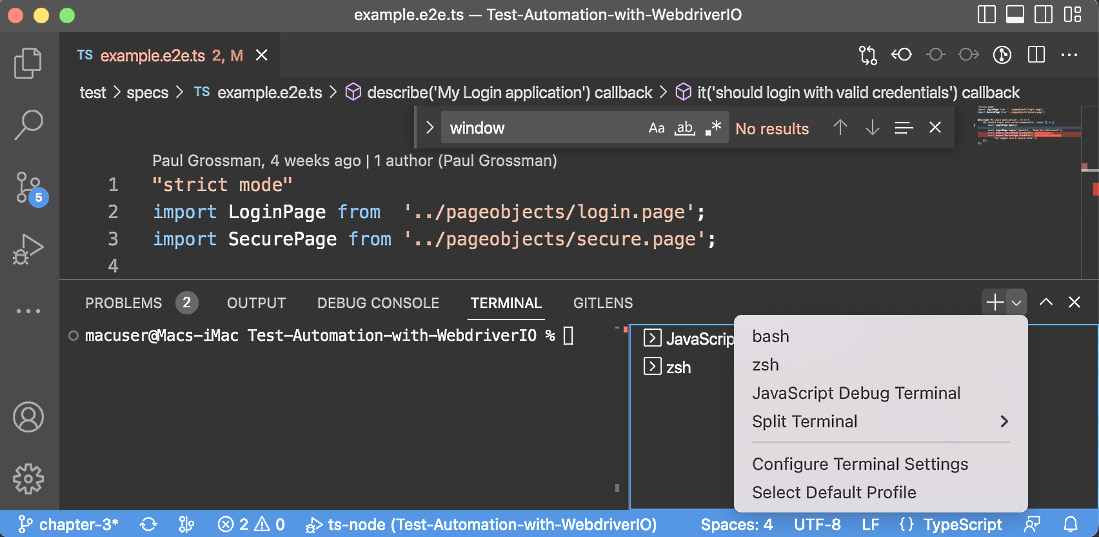
VS Code supplies four command prompt shells to launch scripts. Which one you use depends on your operating system. For Windows, there is PowerShell, Git Bash, Command Prompt, and the JavaScript debug terminal. Mac includes the ZSH shell:

Figure 3.4 – VS Code debugging controls and shell terminals on Windows
Here’s how it looks on Mac:

Figure 3.5 – VS Code debugging controls and shell Terminals on Mac
Script execution stops when a breakpoint is entered in the code by clicking in the gutter to the left of a line number, as seen on line 9. This will attach a debugger and a control panel. From the panel, the code execution can continue, step over a method call, step into the method, step out back up to the calling code, or restart or disconnect the debugging session.
The JavaScript debug terminal always attaches the debugger. Debug mode slows the execution. So, for Mac...


