It is also helpful to become familiar with the Splunk processing tiers and what is called the data pipeline, which consists of the transformation functions that occur as data traverses through Splunk software, in order to—better understand how the various components are configured to work together.
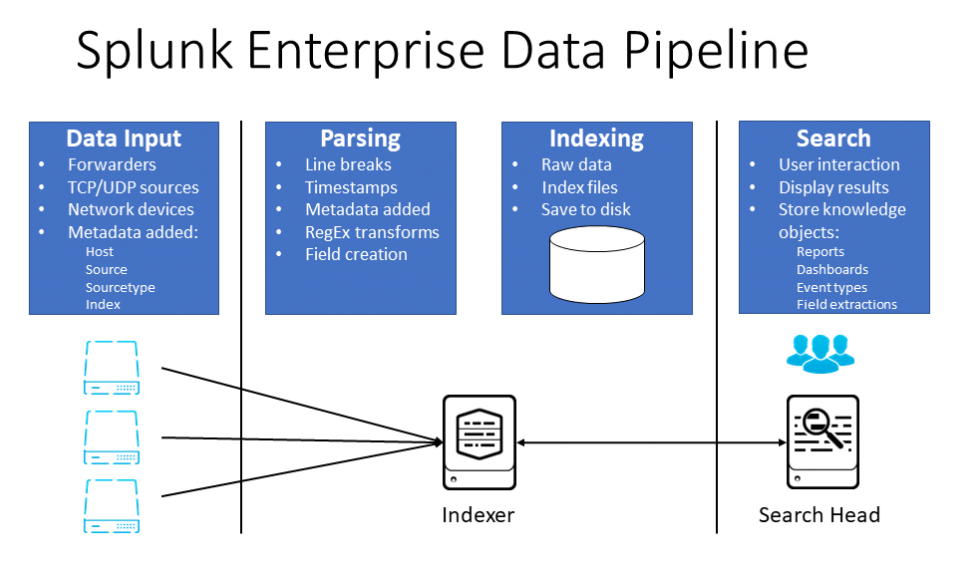
As data that Splunk receives from forwarders or other data sources moves through the data pipeline, Splunk transforms it into searchable events that get indexed. The data pipeline has four segments, as illustrated in the following diagram:

In the Data Input segment, Splunk consumes the raw data stream from forwarders or other data sources, breaks it into 10K blocks, and annotates each block with metadata such as host, source, sourcetype, and the index the data is destined for per the settings in a configuration file.
In the Parsing segment, Splunk breaks data in these blocks into individual events, and identifies, parses, and assigns timestamps to each event. The metadata from the block of data the event came from is assigned to each event, and any required transformations to the event data or metadata are completed.
In the Indexing phase, Splunk writes the individual events to the specified index on disk. It writes both compressed raw data and index files; index files contain pointers to the raw data as well as some metadata to facilitate and speed up the search process.
In a distributed deployment, parsing and indexing are usually referenced together as the indexing process, as these functions are both handled on an indexer. This is okay at a high level, but if you need to inspect the processing of data more closely or determine how to scale and allocate Splunk components, you may need to consider the two segments individually.
The Search segment manages all the aspects of how a user searches, views, and uses the indexed data. It parses and interprets the SPL search commands, requests and receives data from indexers, and formats and presents the results to the user. The search function in Splunk also stores and uses user-created knowledge objects such as event types, tags, macros, field extractions, and so on.
In a distributed deployment, the search function is handled on a search head; in a single-instance Splunk Enterprise server, the input, parsing, indexing, and search functions are all accomplished on that single instance, as you might expect. We will cover all these functions, and how they're configured and interact, in much more detail in the next several chapters.


