We will show you how to install the .NET Compiler Platform SDK, create an analyzer project from a template, and then debug and execute the default analyzer.
Creating, debugging, and executing an analyzer project in Visual Studio
Getting ready
You will need to have Visual Studio 2017 installed on your machine to execute the recipes in this chapter. You can install a free community version of Visual Studio 2017 from https://www.visualstudio.com/thank-you-downloading-visual-studio/?sku=Community&rel=15.
How to do it...
- Start Visual Studio and click on File | New | Project.
- Search for Analyzer templates in the textbox at the top right corner of the New Project dialog, select Download the .NET Compiler Platform SDK, and click on OK:
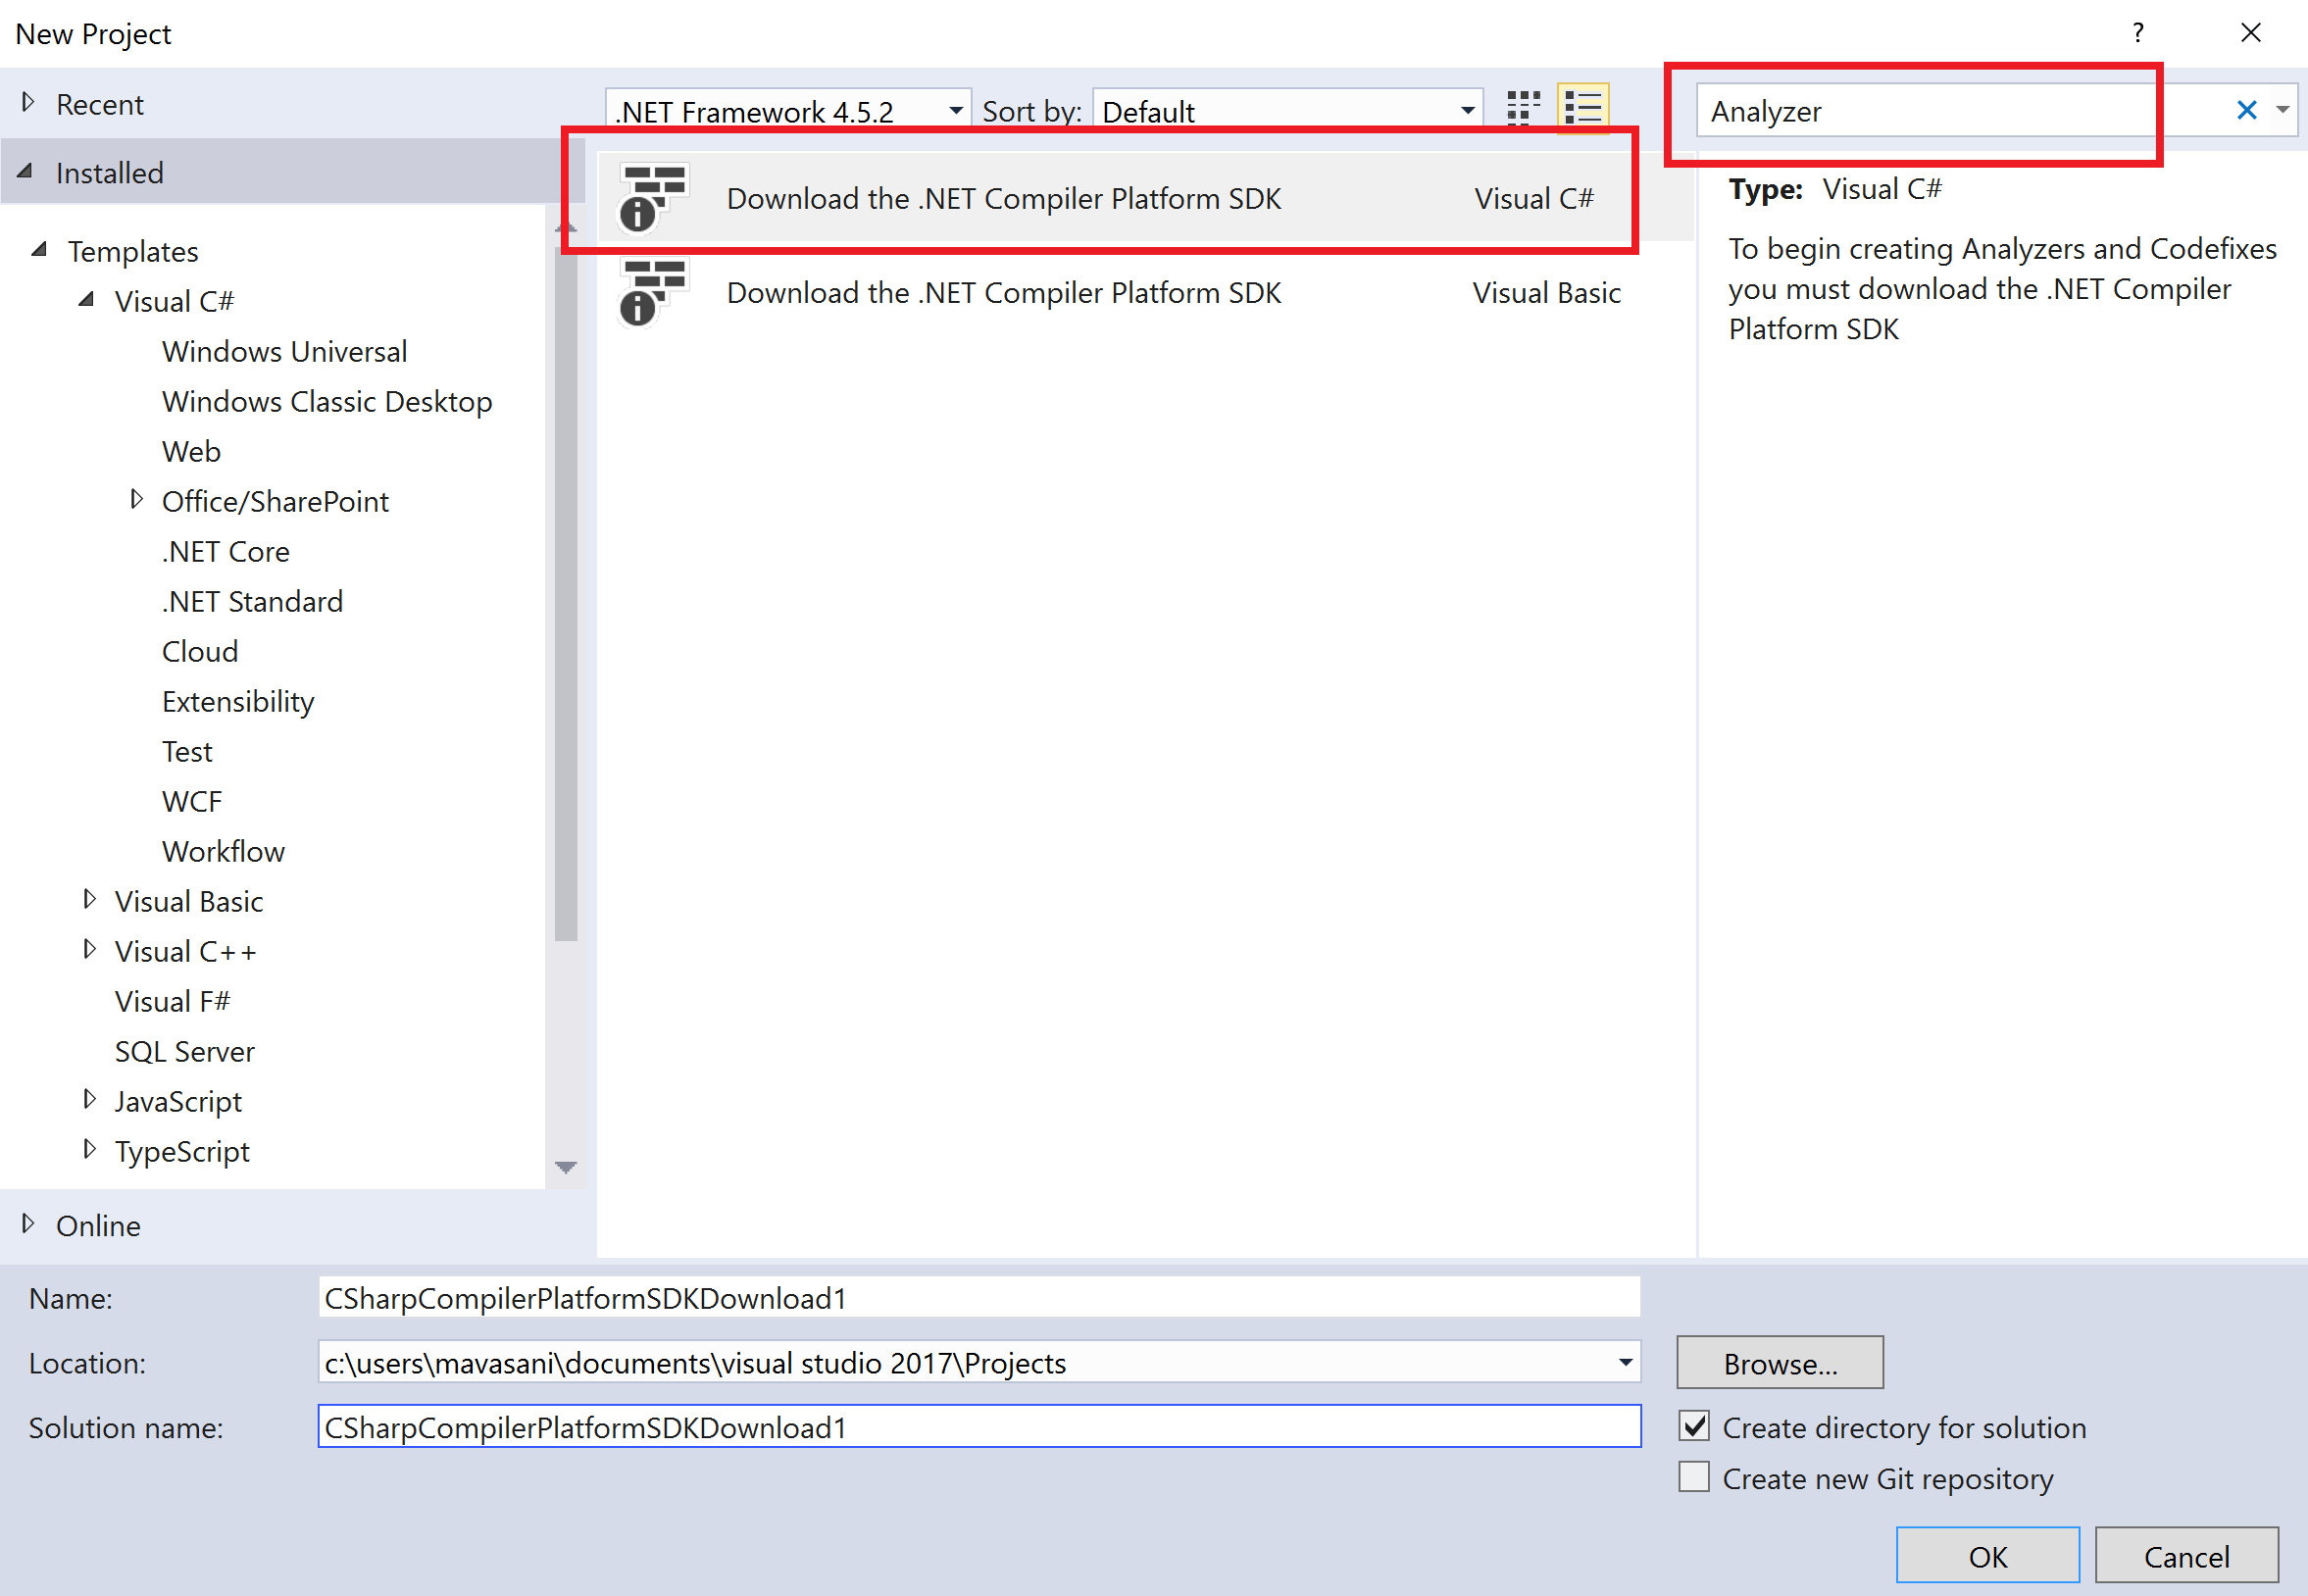
- The new project will have an index.html file opened by default. Click on Download .NET Compiler Platform SDK Templates >> button to install the analyzer SDK templates.

- In the subsequent File Download dialog, click on Open.
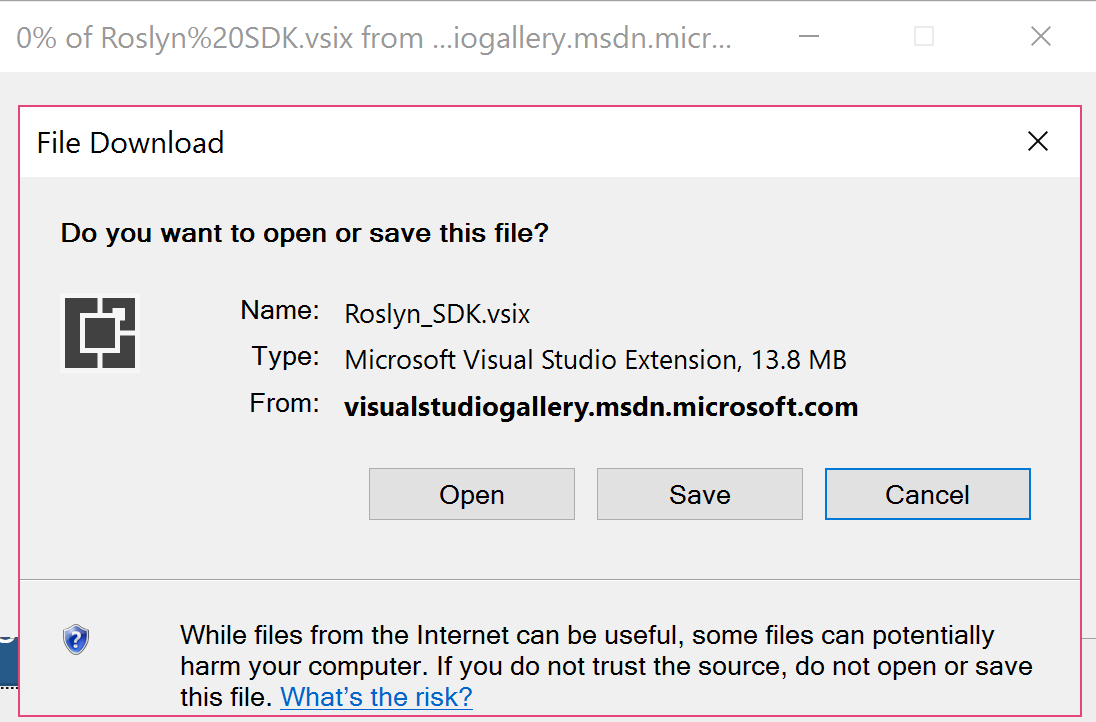
- Click Install on the next VSIX Installer dialog and End Tasks on the subsequent prompt to install the SDK:
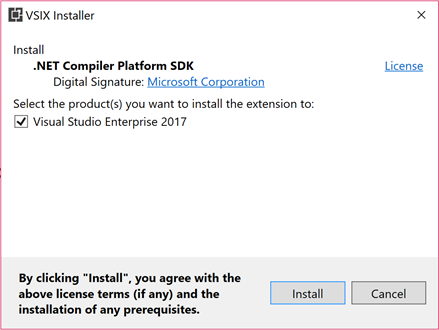
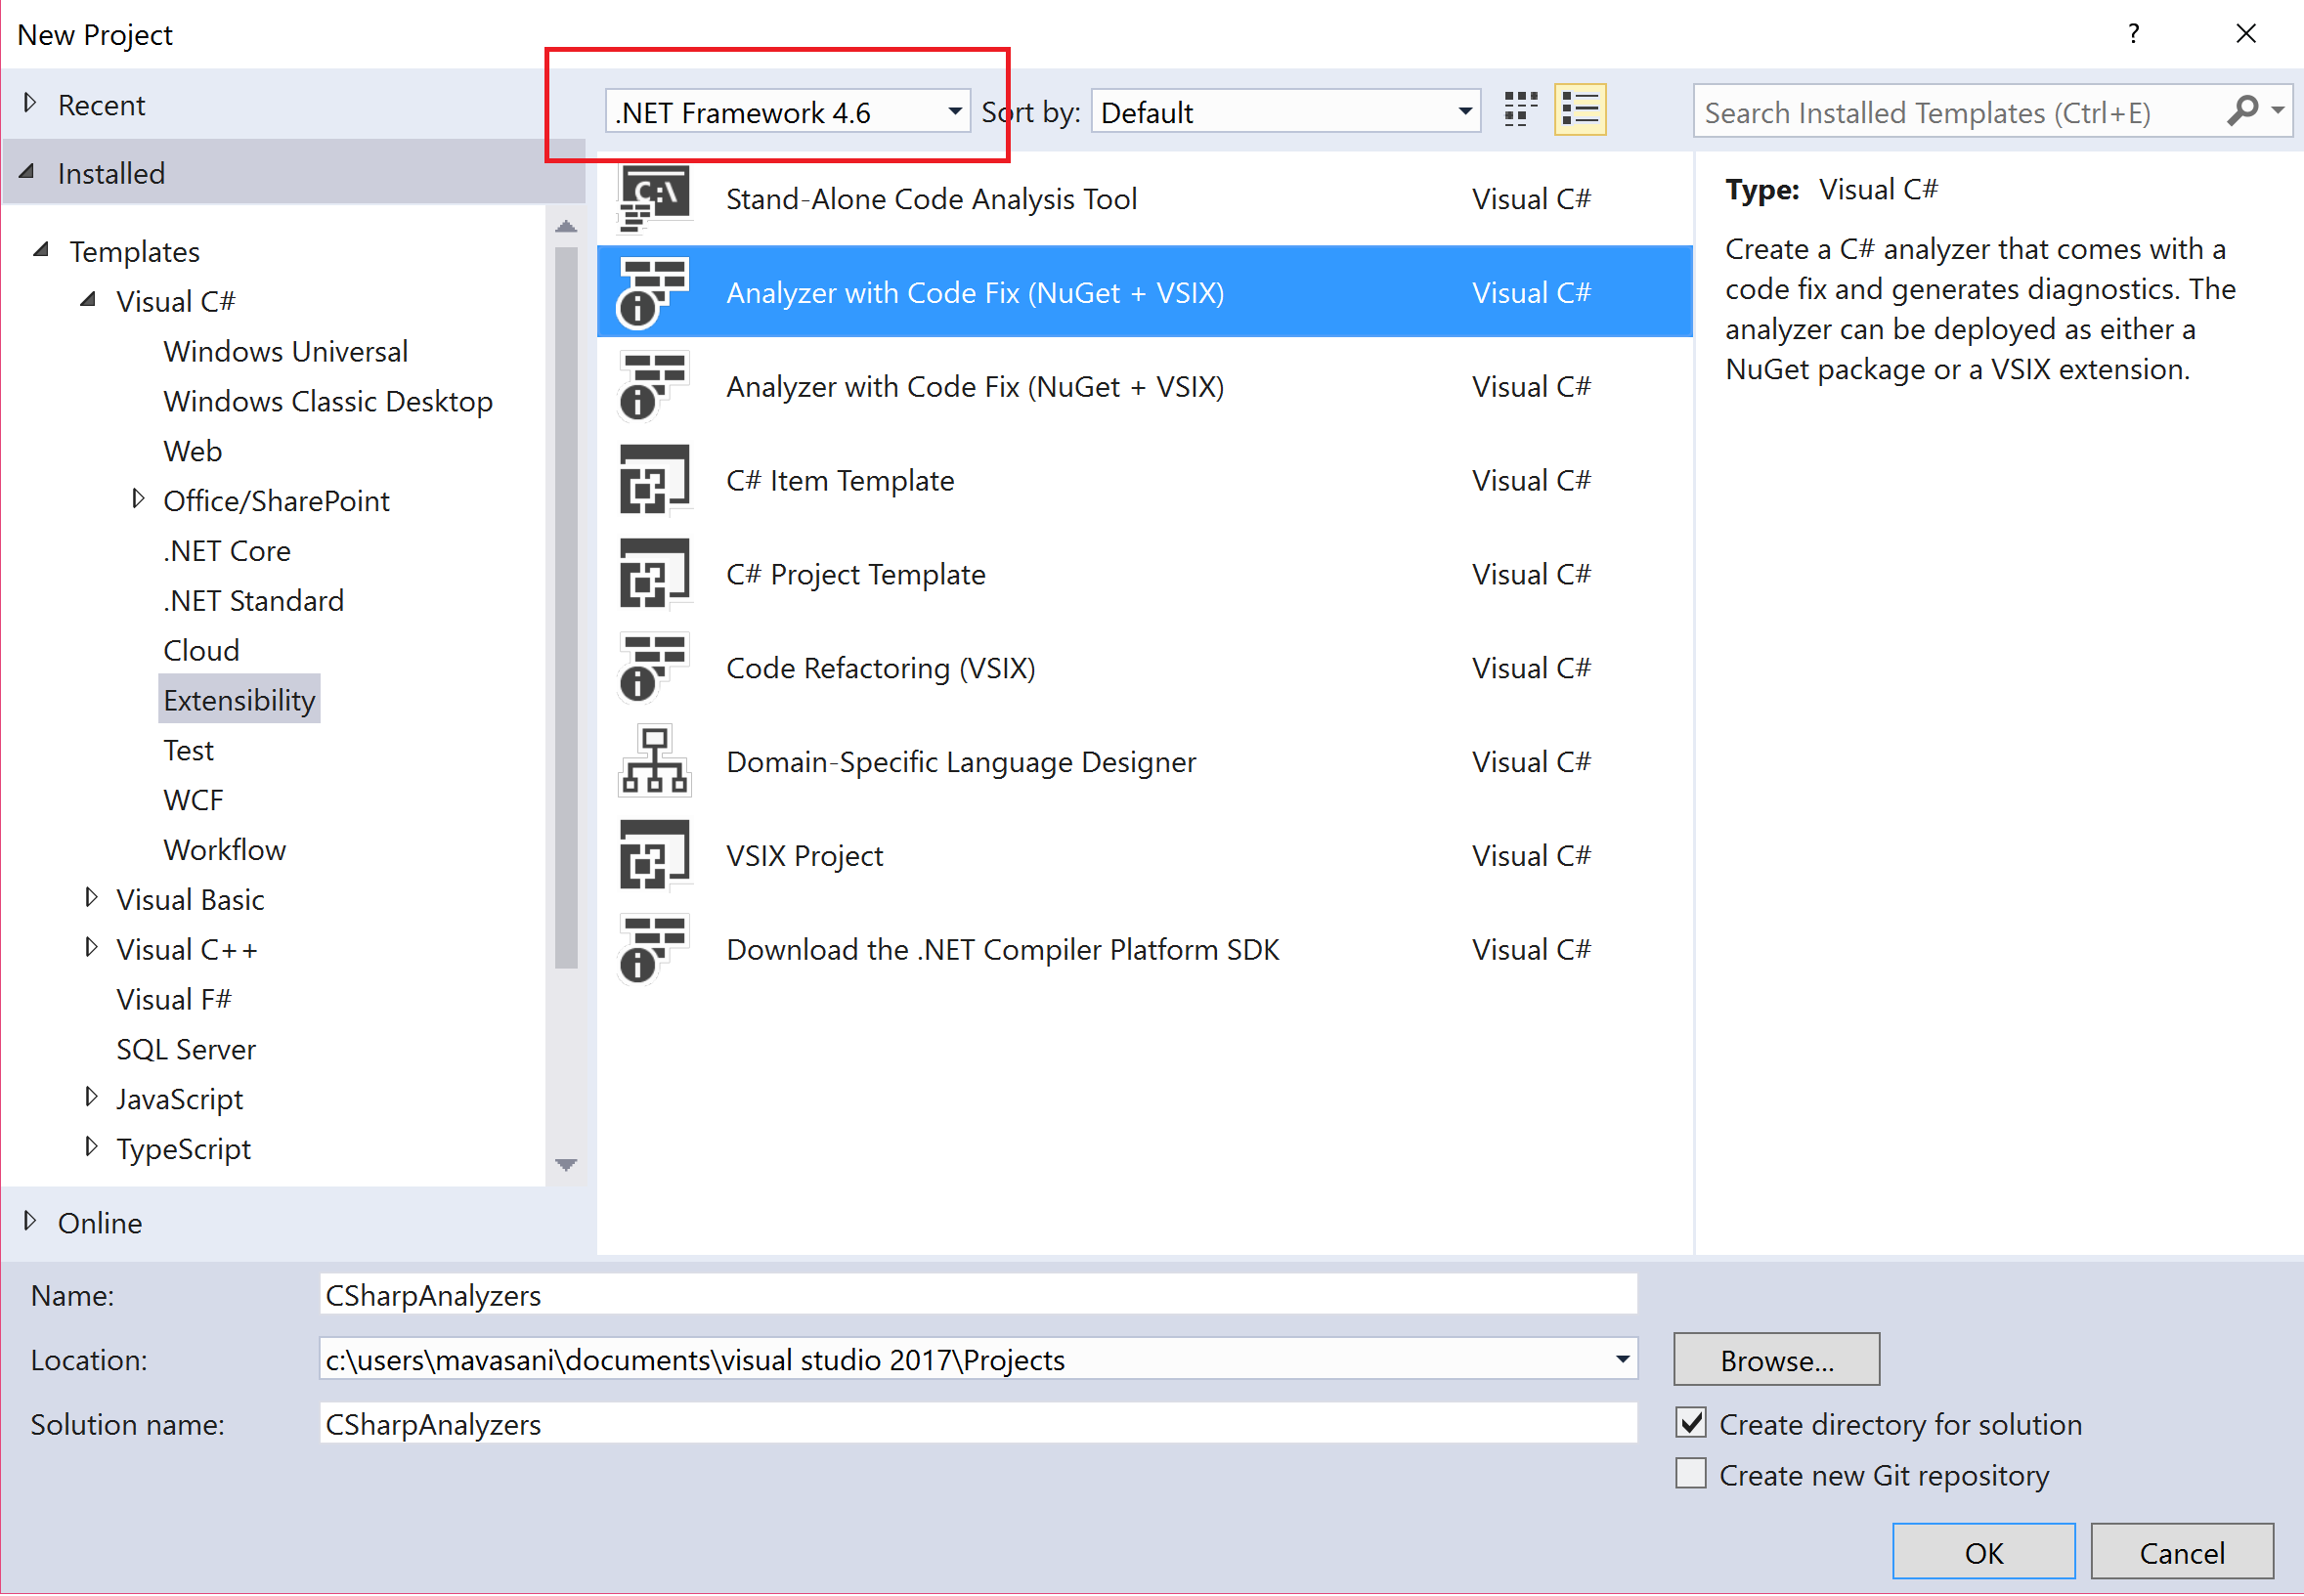
- Start a new instance of Visual Studio and click on File | New | Project... to get the New Project dialog.
- Change the project target framework combo box to .NET Framework 4.6 (or above). Under Visual C# | Extensibility, choose Analyzer with Code Fix (NuGet + VSIX), name your project CSharpAnalyzers, and click on OK.
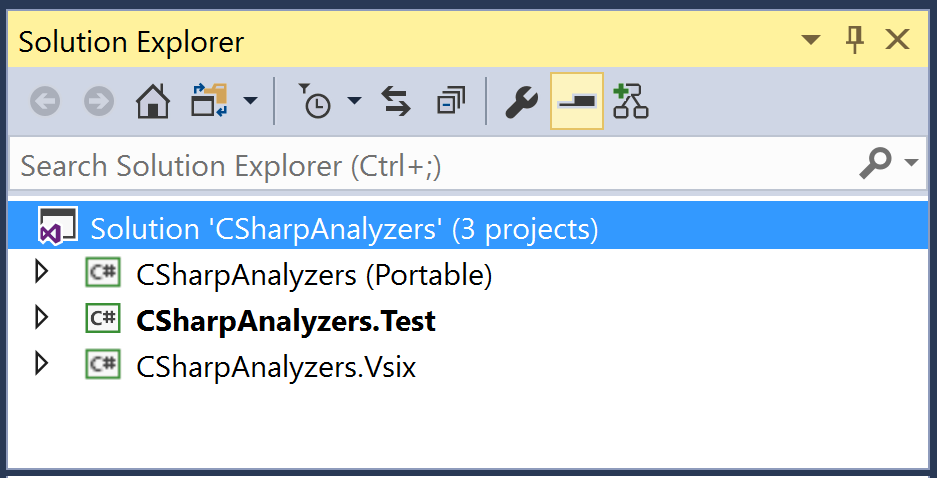
- You should now have an analyzers solution with 3 projects: CSharpAnalyzers (Portable), CSharpAnalyzers.Test , and CSharpAnalyzer.Vsix:
- Open source file DiagnosticAnalyzer.cs in CSharpAnalyzers project and set breakpoints (press F9) at the start of the Initialize and AnalyzeSymbol methods, as shown here:
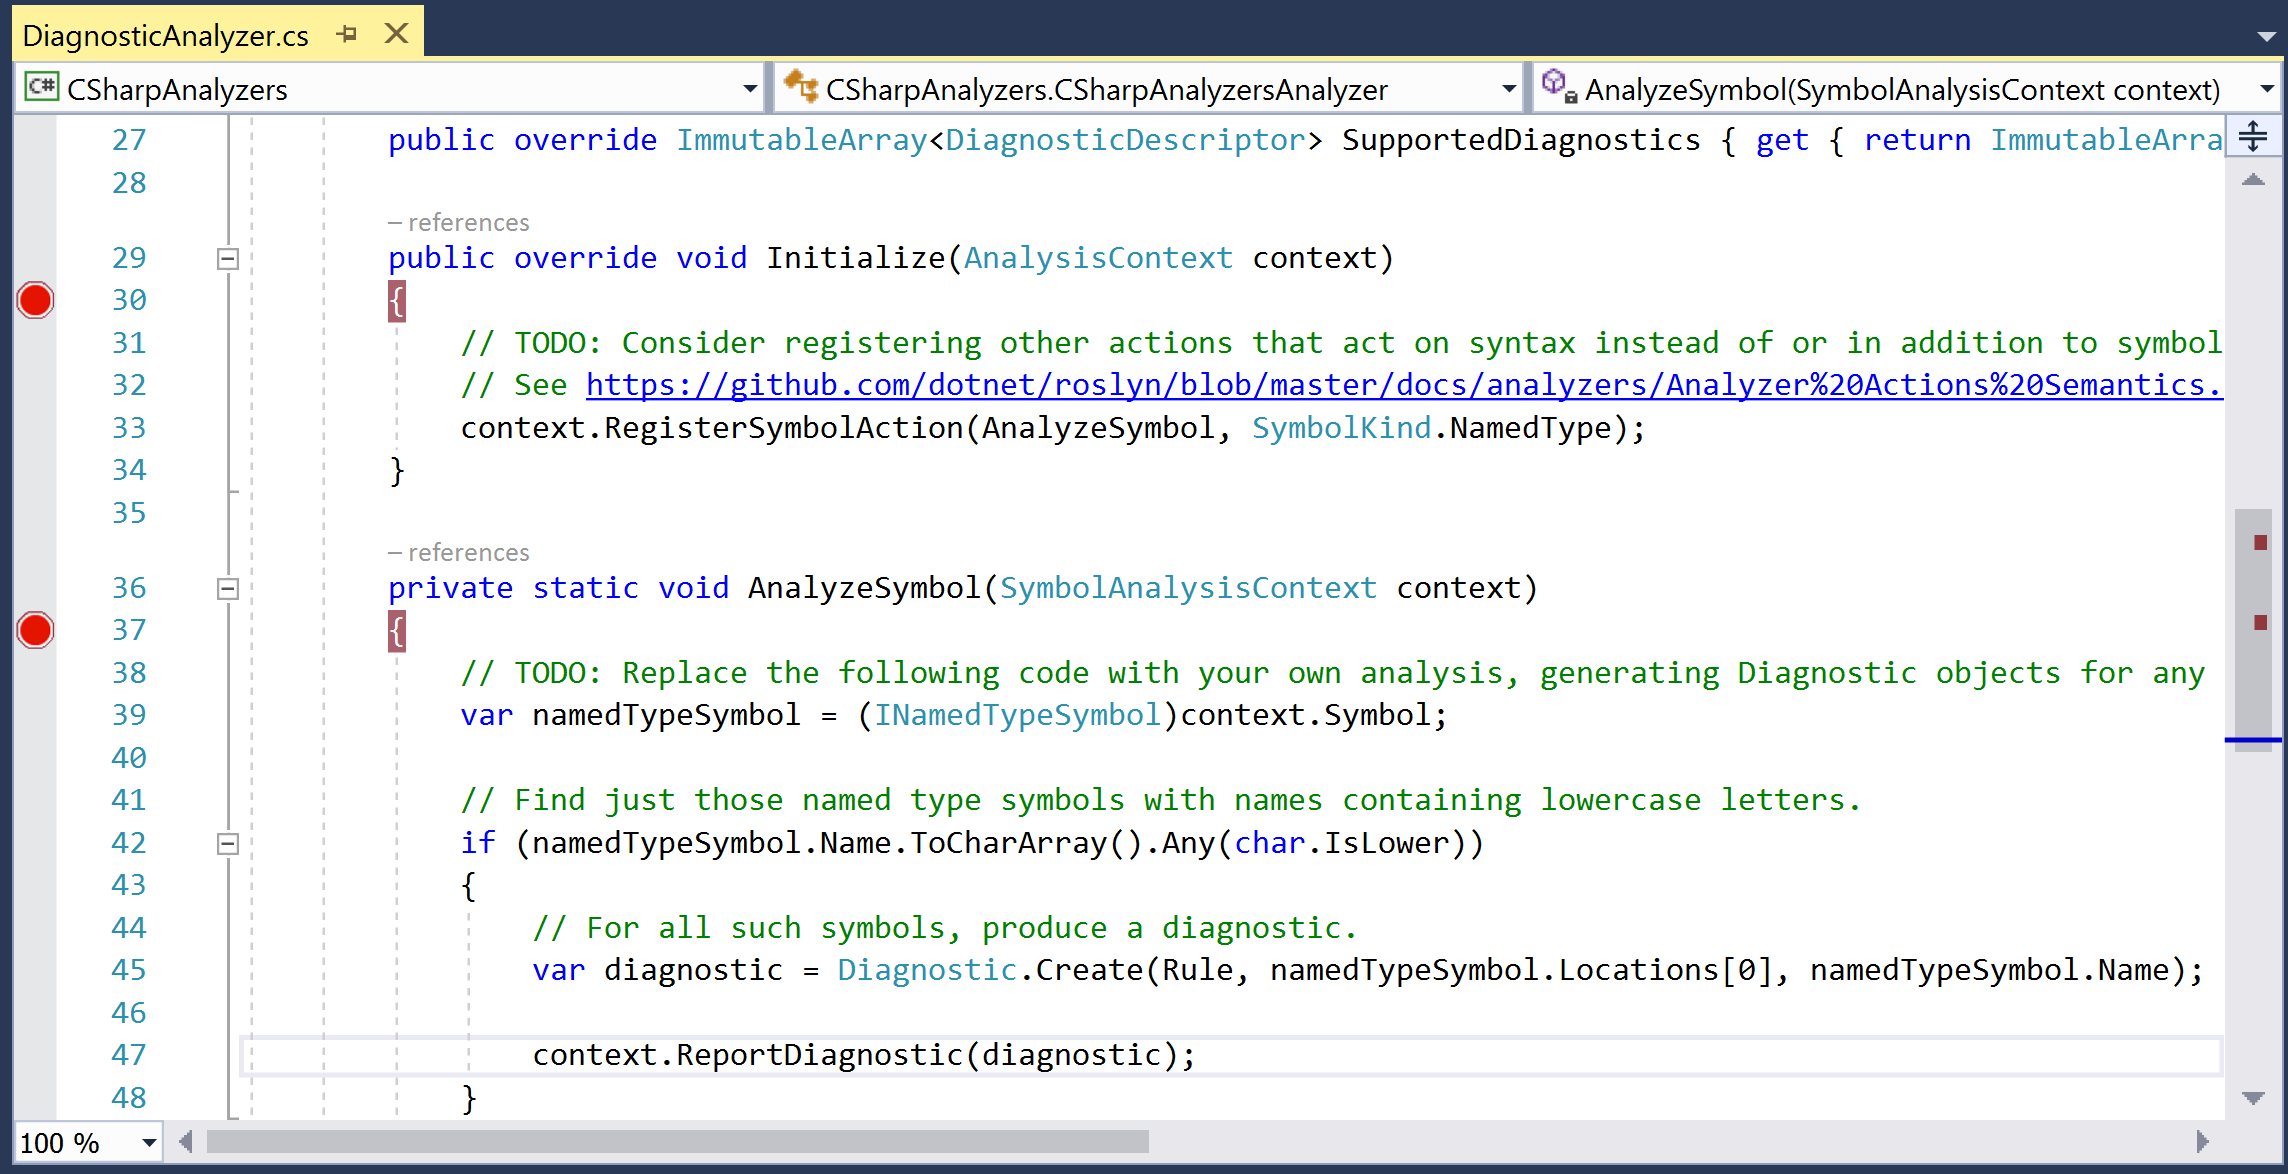
- Set CSharpAnalyzers.Vsix as the start-up project and click on F5 to build the analyzer and start debugging a new instance of Visual Studio with the analyzer enabled.
- In the new Visual Studio instance, create a new C# class library project, say ClassLibrary.
- Verify that we hit both the preceding breakpoints in our analyzer code in the first VS instance. You can step through the analyzer code using F10 or click on F5 to continue debugging.
- We should now see the analyzer diagnostic in the error list and a squiggle in the editor:
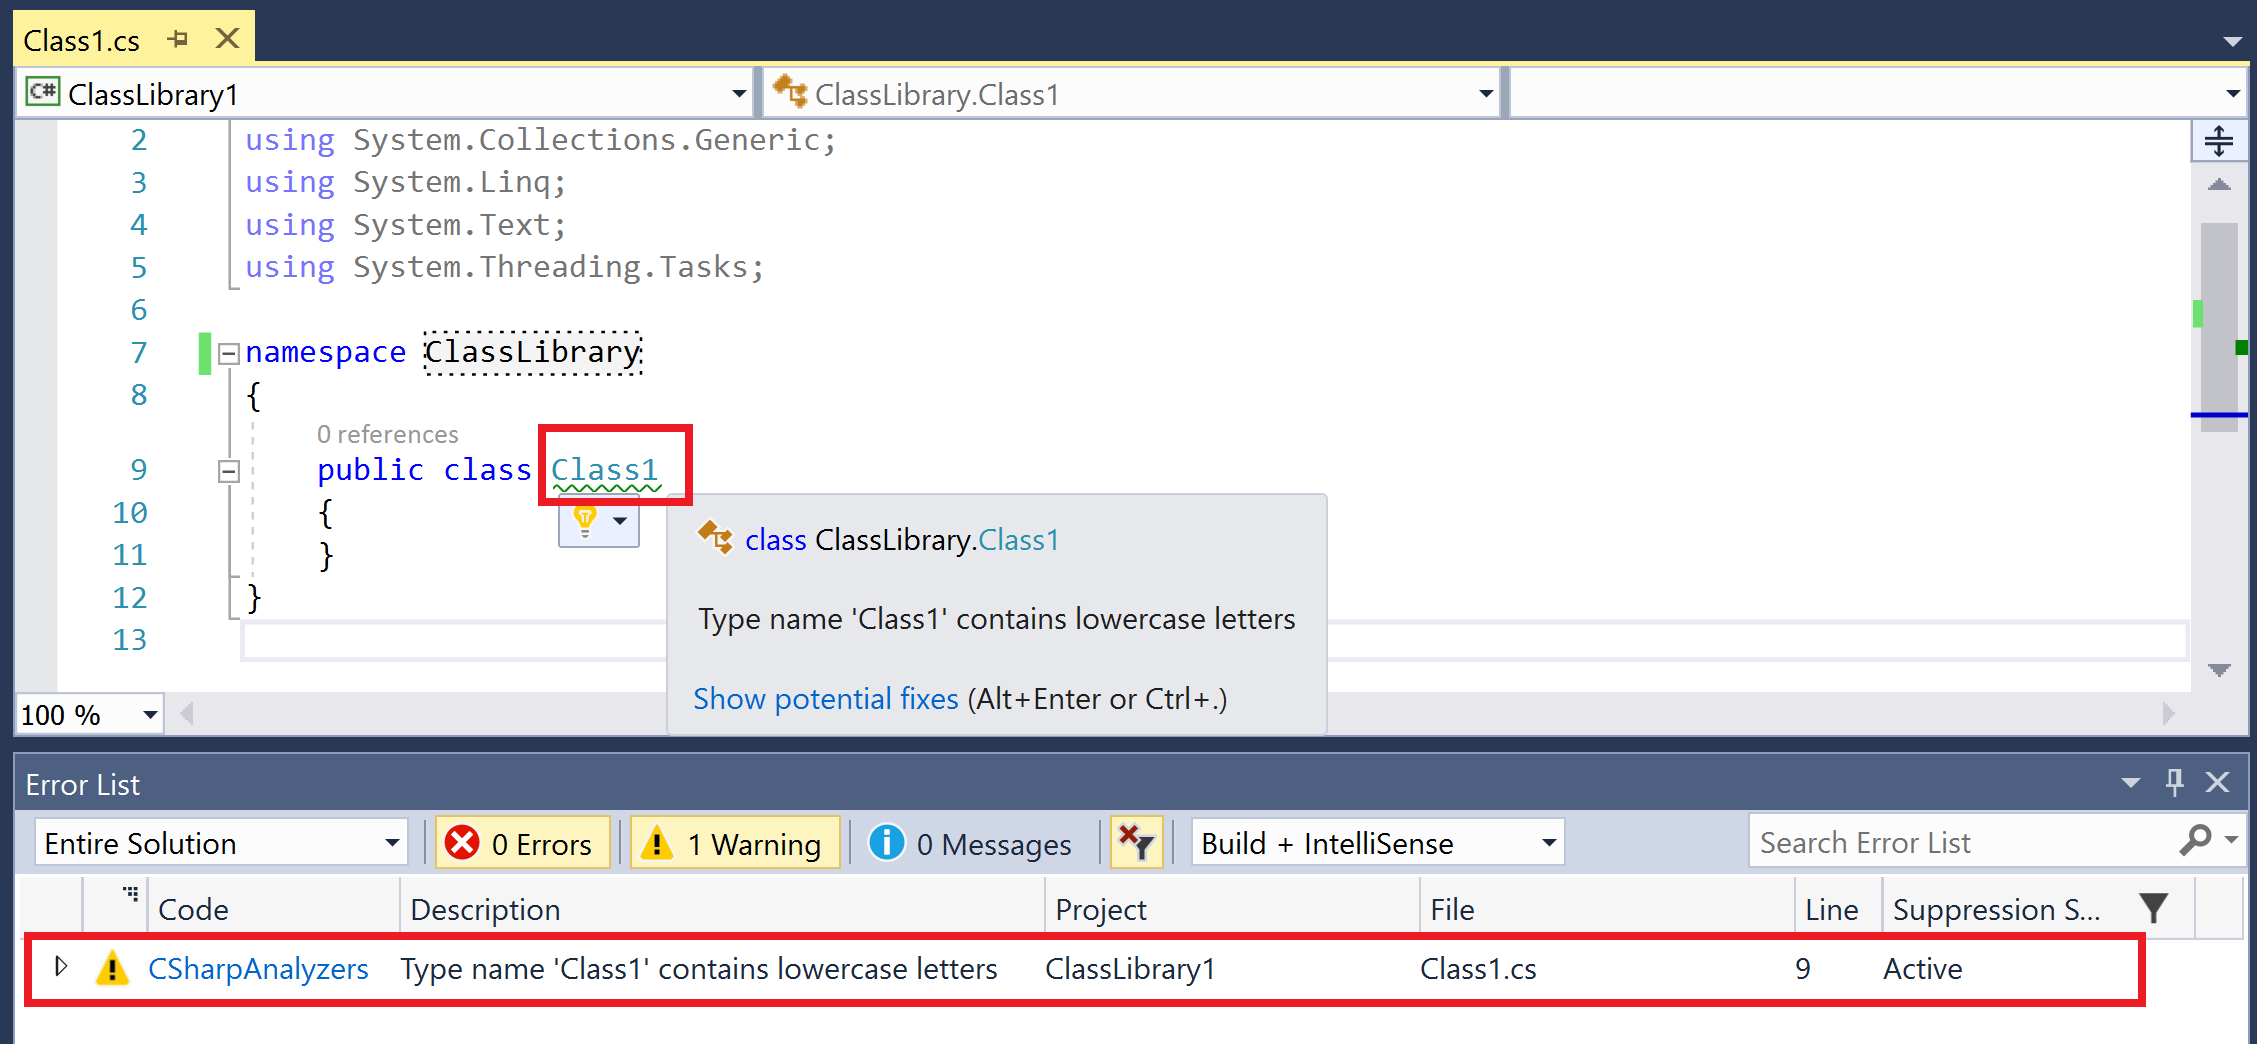
- Edit the name of the class from Class1 to CLASS1.
- We should hit the breakpoint in the AnalyzeSymbol method again. Continue debugging with F5 and the diagnostic and squiggle should go away immediately, demonstrating the powerful live and extensible analysis.
How it works...
.NET Compiler Platform SDK is a wrapper project that redirects us to fetch the project templates for analyzer + CodeFix projects for C# and Visual Basic. Creating a new project from these templates creates a fully functional analyzer project which has a default analyzer, unit tests, and a VSIX project:
- CSharpAnalyzers: Core analyzer project that contains the default analyzer implementation that reports a diagnostic for all type names that contain any lowercase letters.
- CSharpAnalyzers.Test: Analyzer unit test project that contains a couple of analyzer and code fixer unit tests and test helpers.
- CSharpAnalyzers.Vsix: The VSIX project that packages the analyzer into a VSIX. This is the start-up project in the solution.
Clicking on F5 to start debugging the solution builds and deploys the analyzer to the Visual Studio extension hive and then starts a new Visual Studio instance from this hive. Our analyzer is enabled by default for all C# projects created in this VS instance.
Let's expand a bit more on the diagnostic analyzer source code defined in DiagnosticAnalyzers.cs. It contains a type named CSharpAnalyzersAnalyzer, which derives from DiagnosticAnalyzer. DiagnosticAnalyzer is an abstract type with the following two abstract members:
- SupportedDiagnostics property: Analyzer must define one or more supported diagnostic descriptors. Descriptors describe the metadata for the diagnostics that an analyzer can report in analyzer actions. It contains fields such as the diagnostic ID, message format, title, description, hyperlink to documentation for the diagnostic, and so on. Can be used to create and report diagnostics:
private static DiagnosticDescriptor Rule = new DiagnosticDescriptor(DiagnosticId, Title, MessageFormat, Category, DiagnosticSeverity.Warning, isEnabledByDefault: true, description: Description);

public override ImmutableArray<DiagnosticDescriptor> SupportedDiagnostics { get { return ImmutableArray.Create(Rule); } }
- Initialize method: Diagnostic analyzers must implement the Initialize method to register analyzer action callbacks for a specific code entity kind of interest, which is named type symbols for the default analyzer. The initialize method is invoked once for the analyzer lifetime to allow analyzer initialization and registration of actions.
 public override void Initialize(AnalysisContext context)
 {
  context.RegisterSymbolAction(AnalyzeSymbol, SymbolKind.NamedType);
 }

 private static void AnalyzeSymbol(SymbolAnalysisContext context)
 {
   ...
 }
Analyzer actions are invoked for every code entity of interest in a user s source code. Additionally, as the user edits code and a new compilation is created, action callbacks are continuously invoked for entities defined in the new compilation during code editing. The error list makes sure that it only reports the diagnostics from the active compilation.


