


Plotting our first graph
We will start with a simple line graph of a curve of squares, that is, y = x2.
Loading data for plotting
To visualize data, we should of course start with "having" some data. While we assume you have some nice data on hand to show, we will briefly show you how to load it in Python for plotting.
Data structures
There are several common data structures we will keep coming across.
List
List is a basic Python data type for storing a collection of values. A list is created by putting element values inside a square bracket. To reuse our list, we can give it a name and store it like this:
evens = [2,4,6,8,10]
When we want to get a series in a greater range, for instance, to get more data points for our curve of squares to make it smoother, we may use the Python range() function:
evens = range(2,102,2)
This command will give us all even numbers from 2 to 100 (both inclusive) and store it in a list named evens.
Numpy array
Very often, we deal with more complex data. If you need a matrix with multiple columns or want to perform mathematical operations over all elements in a collection, then numpy is for you:
import numpy as np
We abbreviated numpy to np by convention, keeping our code succinct.
np.array() converts a supported data type, a list in this case, into a Numpy array. To produce a numpy array from our evens list, we do the following:
np.array(evens)
pandas dataframe
A pandas dataframe is useful when we have some non-numerical labels or values in our matrix. It does not require homogeneous data, unlike Numpy. Columns can be named. There are also functions such as melt() and pivot_table() that add convenience in reshaping the table to facilitate analysis and plotting.
To convert a list into a pandas dataframe, we do the following:
import pandas as pd
pd.DataFrame(evens)
You can also convert a numpy array into a pandas dataframe.
Loading data from files
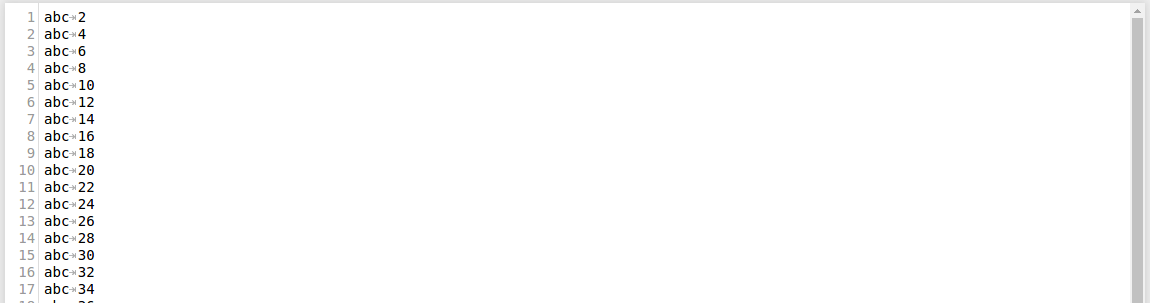
While all this gives you a refresher of the data structures we will be working on, in real life, instead of inventing data, we read it from data sources. A tab-delimited plaintext file is the simplest and most common type of data input. Imagine we have a file called evens.txt containing the aforementioned even numbers. There are two columns. The first column only records unnecessary information. We want to load the data in the second column.
Here is what the dummy text file looks like:
The basic Python way
We can initialize an empty list, read the file line by line, split each line, and append the second element to our list:
evens = []
with open as f:
    for line in f.readlines():
        evens.append(line.split()[1])
Note
Of course, you can also do this in a one-liner:
evens = [int(x.split()[1]) for x in open('evens.txt').readlines()]
We are just trying to go step by step, following the Zen of Python: simple is better than complex.
The Numpy way
It is simple when we have a file with only two columns, and only one column to read, but it can get more tedious when we have an extended table containing thousands of columns and rows and we want to convert them into a Numpy matrix later.
Numpy provides a standard one-liner solution:
import numpy as np
np.loadtxt(‘evens.txt’,delimiter=’\t’,usecols=1,dtype=np.int32)
The first parameter is the path of the data file. The delimiter parameter specifies the string used to separate values, which is a tab here. Because numpy.loadtxt() by default separate values separated by any whitespace into columns by default, this argument can be omitted here. We have set it for demonstration.
For usecols and dtype that specify which columns to read and what data type each column corresponds to, you may pass a single value to each, or a sequence (such as list) for reading multiple columns.
Numpy also by default skips lines starting with #, which typically marks comment or header lines. You may change this behavior by setting the comment parameter.
The pandas way
Similar to Numpy, pandas offers an easy way to load text files into a pandas dataframe:
import pandas as pd
pd.read_csv(usecols=1)
Here the separation can be denoted by either sep or delimiter, which is set as comma , by default (CSV stands for comma-separated values).
There is a long list of less commonly used options available as to determine how different data formats, data types, and errors should be handled. You may refer to the documentation at http://pandas.pydata.org/pandas-docs/stable/generated/pandas.read_csv.html. Besides flat CSV files, Pandas also has other built-in functions for reading other common data formats, such as Excel, JSON, HTML, HDF5, SQL, and Google BigQuery.
To stay focused on data visualization, we will not dig deep into the methods of data cleaning in this book, but this is a survival skill set very helpful in data science. If interested, you can check out resources on data handling with Python.
Importing the Matplotlib pyplot module
The Matplotlib package includes many modules, including artist that controls the aesthetics, and rcParams for setting default values. The Pyplot module is the plotting interface we will mostly deal with, which creates plots of data in an object-oriented manner.
By convention, we use the plt abbreviation when importing:
import matplotlib.pylot as plt
Don't forget to run the Jupyter Notebook cell magic %matplotlib inline to embed your figure in the output.
Note
Don't use the pylab module!
The use of the pylab module is now discouraged, and generally replaced by the object-oriented (OO) interface. While pylab provides some convenience by importing matplotlib.pyplot and numpy under a single namespace. Many pylab examples are still found online today, but it is much better to call the Matplotlib.pyplot and numpy modules separately.
Plotting a curve
Plotting a line graph of the list can be as simple as:
plt.plot(evens)
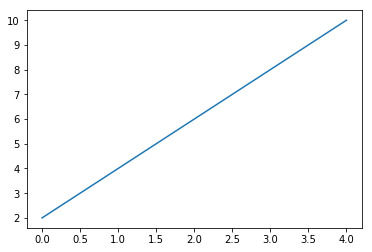
When only one parameter is specified, Pyplot assumes the data we input is on the y axis and chooses a scale for the x axis automatically.
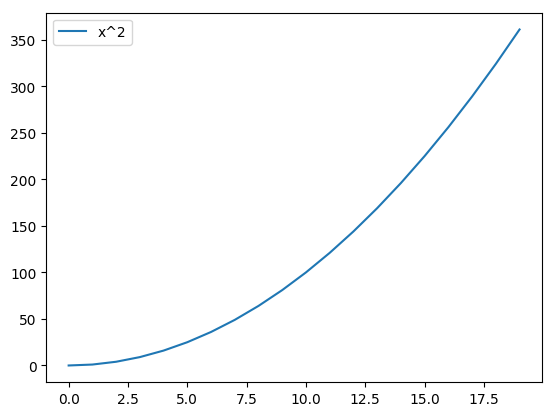
To plot a graph, call plt.plot(x,y) where x and y are the x coordinates and y coordinates of data points:
plt.plot(evens,evens**2)
To label the curve with a legend, we add the label information in the plot function:
plt.plot(evens,evens**2,label = 'x^2')
plt.legend()
Viewing the figure
Now, don’t forget to call plt.show() to display the figure!
Saving the figure
Now we have drawn our first figure. Let's save our work! Surely we don't want to resort to screen capture. Here is a simple way to do it by calling pyplot.savefig().
If you want to both view the image on screen and save it in file, remember to call pyplot.savefig() before pyplot.show() to make sure you don't save a blank canvas.
Setting the output format
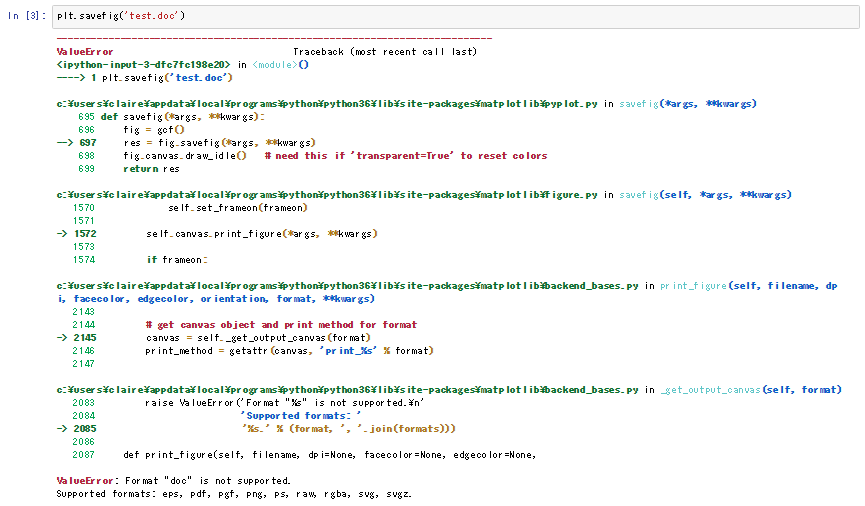
The pyplot.savefig() function takes the path of the output file and automatically outputs it in the specified extension. For example, pyplot.savefig('output.png') will generate a PNG image. If no extension is specified, an SVG image will be generated by default. If the specified format is unsupported, let's say .doc, a ValueError Python exception will be thrown:
PNG (Portable Network Graphics)
Compared to JPEG, another common image file format, PNG, has the advantage of allowing a transparent background. PNG is widely supported by most image viewers and handlers.
PDF (Portable Document Format)
A PDF is a standard document format, which you don't have to worry about the availability of readers. However, most Office software do not support the import of PDF as image.
SVG (Scalable Vector Graphics)
SVG is a vector graphics format that can be scaled without losing details. Hence, better quality can be achieved with a smaller file size. It goes well on the web with HTML5. It may not be supported by some primitive image viewers.
Post (Postscript)
Postscript is a page description language for electronic publishing. It is useful for batch processing images to publish.
Note
The Gimp Drawing Kit (GDK) raster graphics rendering is deprecated in 2.0, which means image formats such as JPG and TIFF are no longer supported with the default backend. We will discuss the backends later in more detail.
Adjusting the resolution
Resolution measures the details recorded in an image. It determines how much you can enlarge your image without losing details. An image with higher resolution retains high quality at larger dimensions, but also has a bigger file size.
Depending on the purpose, you may want to output your figures at different resolutions. Resolution is measured as the number of color pixel dot per inch (dpi). You may adjust the resolution of a figure output by specifying the dpi parameter in the pyplot.savefig() function, for example, by:
plt.savefig('output.png',dpi=300)While a higher resolution delivers better image quality, it also means a larger file size and demands more computer resources. Here are some references of how high should you set your image resolution:
- Slideshow presentations: 96 dpi+
Here are some suggestions by Microsoft for graphics resolution for Powerpoint presentations for different screen sizes: https://support.microsoft.com/en-us/help/827745/how-to-change-the-export-resolution-of-a-powerpoint-slide:
Screen height (pixel) | Resolution (dpi) |
720 | 96 (default) |
750 | 100 |
1125 | 150 |
1500 | 200 |
1875 | 250 |
2250 | 300 |
- Poster presentation: 300 dpi+
- Web : 72 dpi+ (SVG that can scale responsively is recommended)


