Debugging
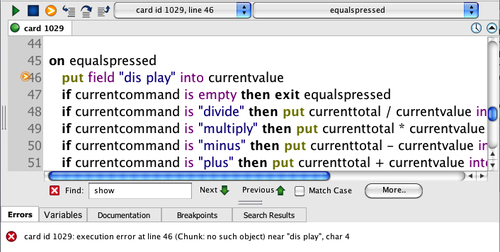
If you did go ahead and try the calculator before we had entered all the scripts it needed, you most likely would have got to see the script debugging in action. Hopefully you managed to cope with what you saw; it can be overwhelming at first. The following screenshot is what it would have looked like:

Most of what you see is the same as when you edit scripts, but if you do see the debug variation you are actually in a paused state, a freeze frame of the program as it runs. In this example the program stopped because line 46 is looking for a field named dis play, and there isn't such a field, it should be display.
The error message at the bottom makes it clear that the error is something to do with the field name, and you would quickly spot the typo. Sometimes though you may need to inspect the variables, to make sure they contain the values you think they should. The Variables tab will show a list of those.
An unexpected problem is the one time you may see the debugger, but when developing a script you are able to set Breakpoints by clicking in the column just to the left-hand side of the line number you want to halt the program at.
Once the script is halted by a breakpoint, you can use the row of buttons at the top to step through the code. Those buttons are:
Continue will set the script running again
Stop will stop the script running, so that you can make changes
Show next statement will show an indicator to the left-hand side of the current line
Step into next statement is used for stepping into a different handler
Step over next statement will go onto the next statement in the current handler, without stepping into a handler mentioned on the current line
Step out of current handler is used to skip the remaining lines in a handler that you had previously stepped into, and exit back out to the handler that called the current one
You will become more familiar with the script editor and debugger as you go along, but that should get you started!


