Search icon CANCEL
Subscription
0
Cart icon
Cart
Close icon
You have no products in your basket yet
Save more on your purchases!
Savings automatically calculated. No voucher code required
Arrow left icon
All Products
Best Sellers
New Releases
Books
Videos
Audiobooks
Learning Hub
Newsletters
Free Learning
Arrow right icon
Arrow up icon
GO TO TOP
Hands-On Machine Learning with Microsoft Excel 2019

You're reading from  Hands-On Machine Learning with Microsoft Excel 2019

Product type Book
Published in Apr 2019
Publisher Packt
ISBN-13 9781789345377
Pages 254 pages
Edition 1st Edition
Languages
Author (1):
Julio Cesar Rodriguez Martino Julio Cesar Rodriguez Martino
Profile icon Julio Cesar Rodriguez Martino
Toc

Table of Contents (17) Chapters close

Preface 1. Section 1: Machine Learning Basics
2. Implementing Machine Learning Algorithms 3. Hands-On Examples of Machine Learning Models 4. Section 2: Data Collection and Preparation
5. Importing Data into Excel from Different Data Sources 6. Data Cleansing and Preliminary Data Analysis 7. Correlations and the Importance of Variables 8. Section 3: Analytics and Machine Learning Models
9. Data Mining Models in Excel Hands-On Examples 10. Implementing Time Series 11. Section 4: Data Visualization and Advanced Machine Learning
12. Visualizing Data in Diagrams, Histograms, and Maps 13. Artificial Neural Networks 14. Azure and Excel - Machine Learning in the Cloud 15. The Future of Machine Learning 16. Assessment

Building data distributions using histograms

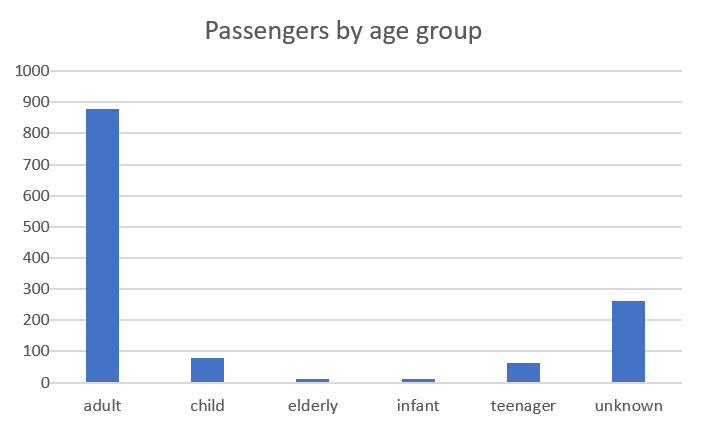
We used histograms in Chapter 5, Correlations and the Importance of Variables, without formally introducing them. This type of chart shows the count of values, either numerical or categorical. To show numerical data, we can build categories, as we did with the age of the Titanic passengers:

Or, we could have used the age variable as a number and distributed the values in bins (groups of data points falling between the same numerical range):

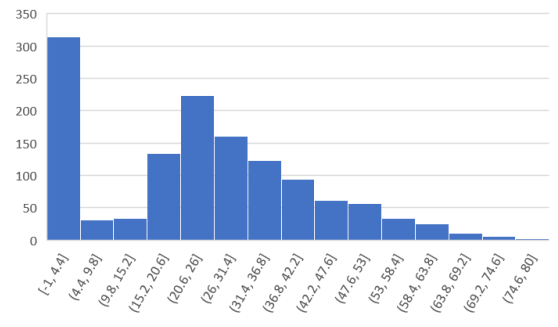
The preceding histogram was created following these steps:

  1. Navigate to Insert | Histogram.
  2. Double-click the x axis to set the number of bins to 15.

We can immediately see a large amount of entries in the first bin corresponding to the missing age values, which we defined as -1 to identify them easily. We also notice that the larger number of passengers were between 20 and 26 years old and that...

lock icon The rest of the chapter is locked
Register for a free Packt account to unlock a world of extra content!
A free Packt account unlocks extra newsletters, articles, discounted offers, and much more. Start advancing your knowledge today.
Unlock this book and the full library FREE for 7 days
Get unlimited access to 7000+ expert-authored eBooks and videos courses covering every tech area you can think of
Renews at €14.99/month. Cancel anytime