The mode is the value in a list which appears the most frequently. In this section, we are going to discuss an algorithm for finding the mode. We will first try to understand how the mode of a list can be solved using Run-Length Encoding (RLE). We will then break that problem of RLE into parts, and then write the code for our function. Finally, we will use RLE in order to find the mode of a dataset, and then we're going to compute the mode of our 2015 away runs dataset.
To find the mode, we will have to do yet another import. We need to go back up to the very top of the Baseball dataset and import Data.Ord:

We need this for a function that we'll use later on in this section. Now, let's restart and rerun all—it'll take a moment. Next, let's create a list, called myList, that we will use in order to demonstrate the mode:

Now the value that appears the most frequently in this list, of course, is 4. Next, we would like to introduce an algorithm known as RLE. Now, RLE is an algorithm for lossless compression and it has a few interesting applications to it. We can find the mode of a list by first running RLE, and in order to find RLE, we need to understand how elements group together. So, there is a function in Data.List, called group, which can help create a list of list, and each sublist in our primary list is a grouping of the values as follows:

So, here we have group List [[4,4], [5,5], [4]]. Now we can easily count each element in the sublist, thus creating a run-length encoding. So, let's create a function to represent RLE, which we need to be of the right type for our values:

We're going to accept any element as an input, and then return a list consisting of a tuple of those elements, followed by an integer, where the integer is going to represent the number of sub-elements in that list. So, runLengthEncoding is going to be any list we get in, and we are going to map over that list. With that sublist, we will first get the head of the list; and second, we will get the generic length of xs. Once we get that generic length, we're going to compute the group:

So, if we pass in runLengthEncoding of our myList, we compute the run-length encoding of our original list, where each element in order represents the element that is seen and how many times that element is seen. We got [(4,2), (5,2), (4,1)], so there'll be an even number of elements; and for convenience's sake, we group them in tuples.
If we do runLengthEncoding with an empty list, we will get back an empty list:

But here's where it gets interesting. If we do runLengthEncoding and we first sort myList of values, we now have a tuple of values where all of the 4s are grouped together and all of the 5s are grouped together:

So, we have three 4s and two 5s. Now what we can do is perform run-length encoding on the sorted version of our dataset, and then look for whatever tuple has the highest second value. So, this next algorithm computes the mode of a list using the runLengthEncoding function, and here, we are using a function called maximumBy:

maximumBy is found in the Data.Ord library, and it requires that we are comparing based on whatever the second value is, that is, the snd; and we are comparing on whatever that integer is, which, as we identified earlier, is the length of a sublist. All our mode function does is sorts the values, passes that data to runLengthEncoding, and then finds which element in the list has the highest second value, thus representing the mode. Let's check this out:

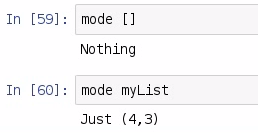
So, if we pass in an empty list to our mode, we get back Nothing, and if we pass myList to the mode from our earlier example, we get back Just 4,3. So, the first element in the tuple will be the most frequently seen element, and the second element is how many times that first element is seen. In our case, 4 is seen 3 times. We've been working with our Baseball dataset, and we have our away-team runs, so now we can find which away-team run appears most frequently in the 2015 baseball season:

mode awayRuns will give us the answer that there were 379 games in the season in which 2 runs were scored, and that 2 runs was the most frequently seen result.


