Accessing Web Browser Developer Tools
Our understanding of JavaScript's relationship with the web browser is becoming clearer with each topic that we discuss. In the previous exercise, we saw how to dig in and discover the different levels of JavaScript feature support across different web browsers. That leads us directly to have a look at the various browsers themselves, as well as the tools that are available within each for inspecting and even writing JavaScript code.
Browsers are built to abide by standards such as HTML and CSS. However, there are many differences in both the interpretation of these standards and in the tooling available with each major web browser. When writing JavaScript for the web browser, it is important to know how to access and use the browser developer tools—especially the JavaScript console tab.
Google Chrome
Chrome is the most popular web browser at the time of this writing—this fact holds true for both general users and developers. Chrome was initially released in September 2008 and is now available on multiple desktops and mobile operating systems.
Note
You can download Google Chrome from https://packt.live/2NQRQcn.
To access developer tools and the JavaScript console within Chrome, you can right-click anywhere in the viewport and choose Inspect from the menu that appears. Alternatively, press F12. Once the developer tools are open, click on the Console tab to inspect and write JavaScript code within Chrome itself:
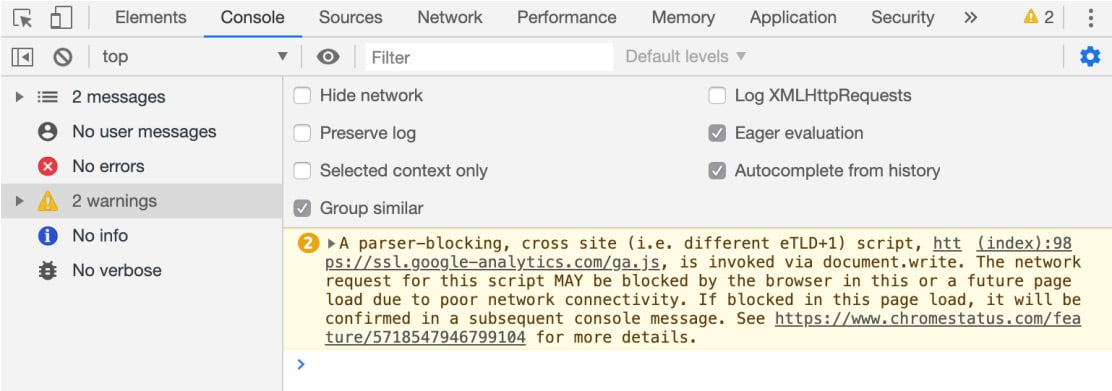
Figure 1.8: Google Chrome Developer Tools
Using the Chrome developer tools, you can filter the sort of things that show errors, warnings, or even just information such as that returned by console.log(). You can even write JavaScript within the browser using the Console tab view, as you'll see shortly. There is also a Sources tab, which allows for modifying and debugging of code.
Microsoft Edge
Having once reigned as the most used web browser in the world, Internet Explorer reached its final version with IE11. This doesn't mean that Microsoft is finished with web browsers though, as, with the release of Windows 10, the newly created Edge browser was made available to users as a replacement in July 2015.
Note
Microsoft Edge comes installed with Windows 10 (https://packt.live/2CnMv6P).
To access the developer tools and the JavaScript console within Edge, you can right-click anywhere in the viewport and choose Inspect Element from the menu that appears. Alternatively, press F12:
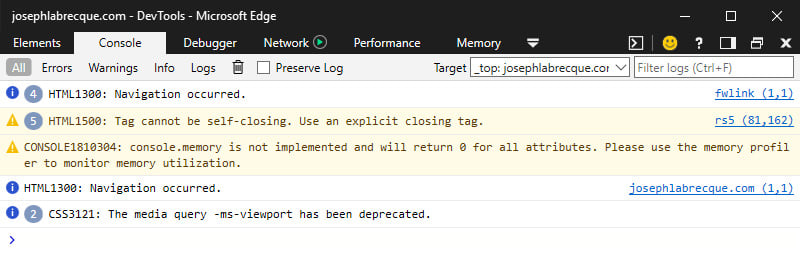
Figure 1.9: Microsoft Edge Developer Tools
The developer tools in Microsoft Edge are pretty ugly, aren't they? Much like other browsers, Edge's developer tools include a Console and a JavaScript Debugger view. Similar to Chrome, you can also filter the types of output present in the Console itself as your code executes.
Note
As of this writing, Microsoft Edge is being rewritten based on a Chromium base. This will mean that Chrome, Opera, Safari, and Edge will eventually make use of the exact same browser technologies under the hood.
Apple Safari
On Apple macOS and iOS operating systems, Safari is the default web browser and is tightly integrated into the user experience on those machines. Similar to Windows and Internet Explorer/Edge, many users will never deviate from the browser that is preinstalled on their machine.
Safari was once even available on Windows, but development ceased with the final Windows version in 2012.
Note
Apple Safari comes installed with Apple macOS (https://packt.live/32moJTq).
To access the developer tools and the JavaScript console within Safari, you must first tweak some of the preferences within the browser itself. Let's get started:
- First, access the preferences dialog by choosing
Safari|Preferencesthrough theApplicationmenu. - Within the
Preferencesdialog, click on the tab calledAdvanced. - Once the contents of the
Advancedtab has appeared, look to the bottom and enable theShow Develop menu in menu bar option:
Figure 1.10: Apple Safari Advanced Preferences
- With that option enabled, close the
Preferencesdialog. - Now, choose the newly enabled
Developoption from theApplicationmenu and selectShow JavaScript Consoleto display the developer tools. You can also right-click and chooseInspect Elementas well.
The good news is that once the Develop menu is enabled, it will remain so between sessions. You'll only need to open the developer tools to access these features:

Figure 1.11: Apple Safari Developer Tools
Today, Safari does seem to lag behind most other browsers in adopting certain features, but you will find Apple's version of the Console and Debugger views in the developer tools all the same.


