Setting up your development environment
I asked you to follow along. I requested that you open up your development environment and do what I do. However, to do that, you need to set up the right kind of development environment so that you can actually do what I do.
Let me help you with that.
I use Visual Studio 2022 Enterprise. There is no particular reason I use the Enterprise version besides having that on my machine. There are two other versions: The Professional and the free Community edition. All three versions are fine for the things we want to do. However, the Enterprise edition does have some debugging tools we might need when discussing debugging. When that time comes, I will pinpoint the differences and show you other ways of achieving your goals.
Alternatives such as JetBrains Rider and Visual Studio Code also work, but you might have to do more work yourself when we go into performance tuning and debugging. Again, I will tell you about these when we get there.
I have limited experience with Rider, so I cannot tell you precisely what you need to do, but I am sure that when you are an experienced developer, you can translate what I am showing you into the tools you know and love.
Use what you have and what you know. I am cool with that.
If you decide to go with Visual Studio, which I highly recommend, you should use version 2022 instead of 2019. The latest versions of .NET and C# offer a lot related to performance tuning and memory optimizations. Those versions are only available in the 2022 version of Visual Studio. So, make sure you have that one on your device.
Next to that, we will be doing a lot of console stuff. That means using PowerShell: gone are the days of using cmd.exe.
I highly recommend downloading Windows Terminal. With Terminal, you can have all sorts of consoles. We will use PowerShell most of the time, but when we talk about Linux, we will use the WSL feature to use our machines as Linux machines.
Downloading and installing Terminal is a breeze: you can find it on the Microsoft Store.
Make sure to install Windows Subsystem for Linux as well. Instructions on how to do that are all over the internet; I will not repeat that here.
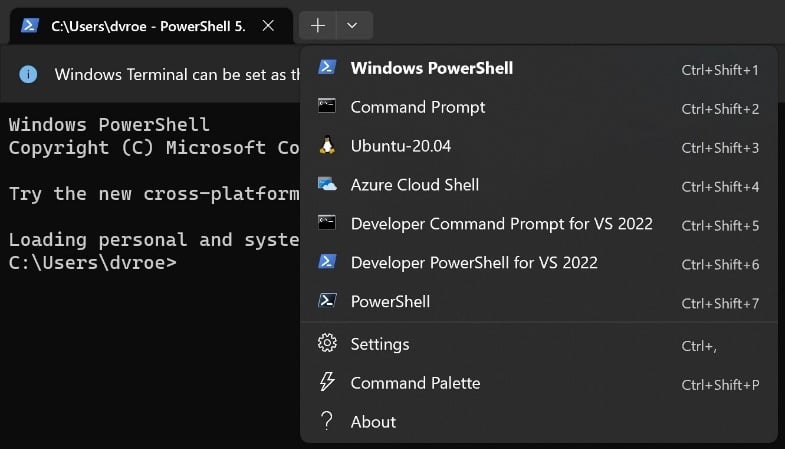
Once you have installed all of your favorite tools, you can select any one of them in your Terminal. Mine looks like this:

Figure 0.6: Windows Terminal with different shells
As you can see, I have PowerShell, Command Prompt, Ubuntu, Azure Cloud Shell, and some more installed. Selecting one of them is a matter of clicking.
Switching between Linux and Windows has never been easier!
Another tool we will be using later on is WinDbg. WinDbg is an extremely powerful external debugger. It can give you a lot of information about the processes you are interested in. It runs standalone, so you do not have to attach Visual Studio to the process. There are versions available for both X86 and ARM, so it is usable on many devices. You can find WinDbg on the Microsoft website at https://learn.microsoft.com/en-us/windows-hardware/drivers/debugger/. Download and install that. WinDbg might become one of your latest best friends.
Next, you might want to install PerfView. It is a free and open-source performance monitoring tool from Microsoft, specially built for analyzing performance on .NET applications.
You can find the source code at https://github.com/Microsoft/perfview. You can download the sources and build the tool yourself or grab one of the pre-build versions. Those are also on that same site. I would suggest building yourself and looking through the source code: there are some terrific examples of how to build software like this. I do not intend to describe how the tool works internally, but I will use it when discussing performance.
Now, all you need is a cup of your favorite beverage, and we are good to go!


