Debugging Oracle JET applications
Debugging the web interface application is a bit tricky, especially when dealing with JavaScript-based content. With a number of components being reused and developed by multiple developers across the project, managing the dependencies across multiple production releases and reviewing any defects that are raised in web interface components, is a tricky exercise.
Using browser extensions
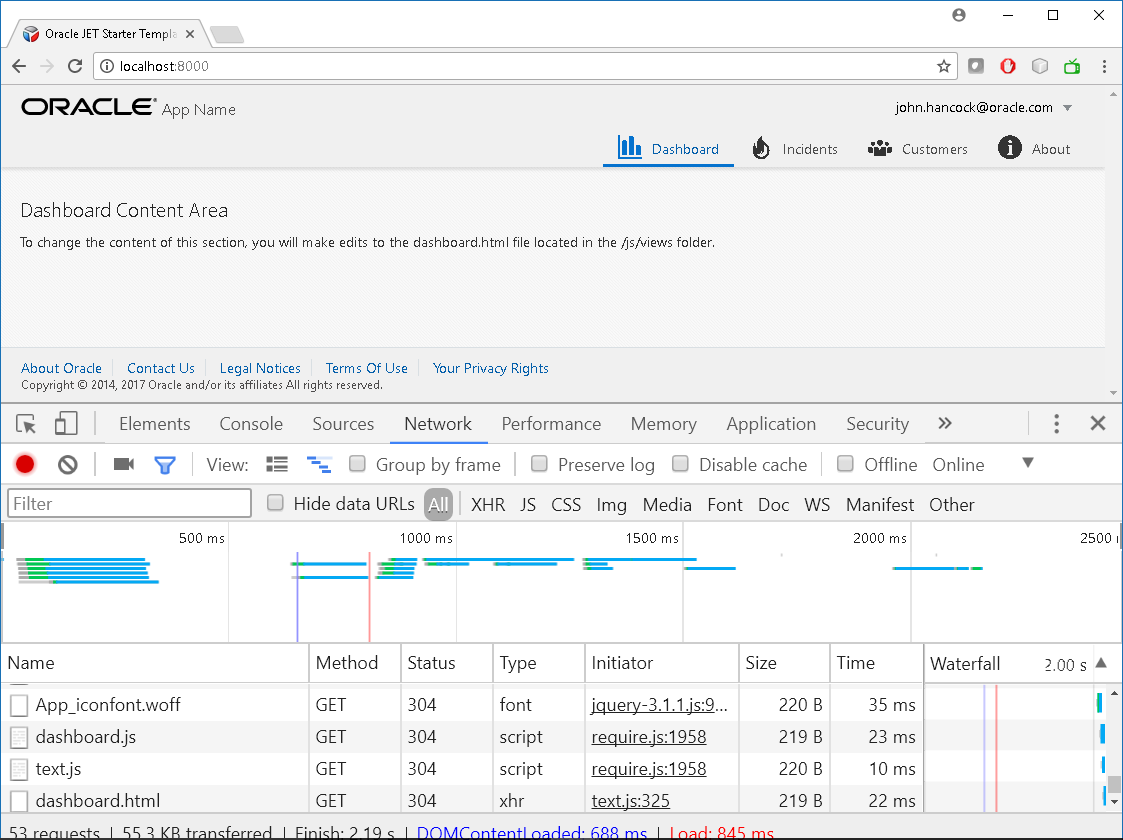
One option is to review the output by inserting console output and checking the browser console. (For example, select More Tools | Developer Tools from Chrome's main menu. Right-click a page element and select Inspect.) Developer tools have features such as device mode, elements panel, console, sources, network, performance, memory, application, and security panels to help us debug the application further.
The following is a screenshot of the Oracle JET page with browser debugging enabled and populating the components loading through the network:

Using IDE extensions
We can...


