
Once questions are asked in the right direction, the target of data exploration is clear. So, the next step is to see where the data comes from. Data collected can be much unorganized and in very diverse formats, which may involve reading from a database, internet, file system, or other documents. Most of the tools for machine learning require data to be presented in a specific format in order to generate the proper result. We have two choices: observe the data from existing sources or generate the data via surveys, simulations, and experiments. Let's take a closer look at both approaches.
Data collection
Finding or observing data
Data can be found or observed in many places. An obvious data source is the internet. With an increase in social media usage, and with mobile phones penetrating deeper as mobile data plans become cheaper or even offer unlimited data, there has been an exponential rise in data consumed by users.
Now, online streaming platforms have emerged—the following diagram shows that the hours spent on consuming video data is also growing rapidly:
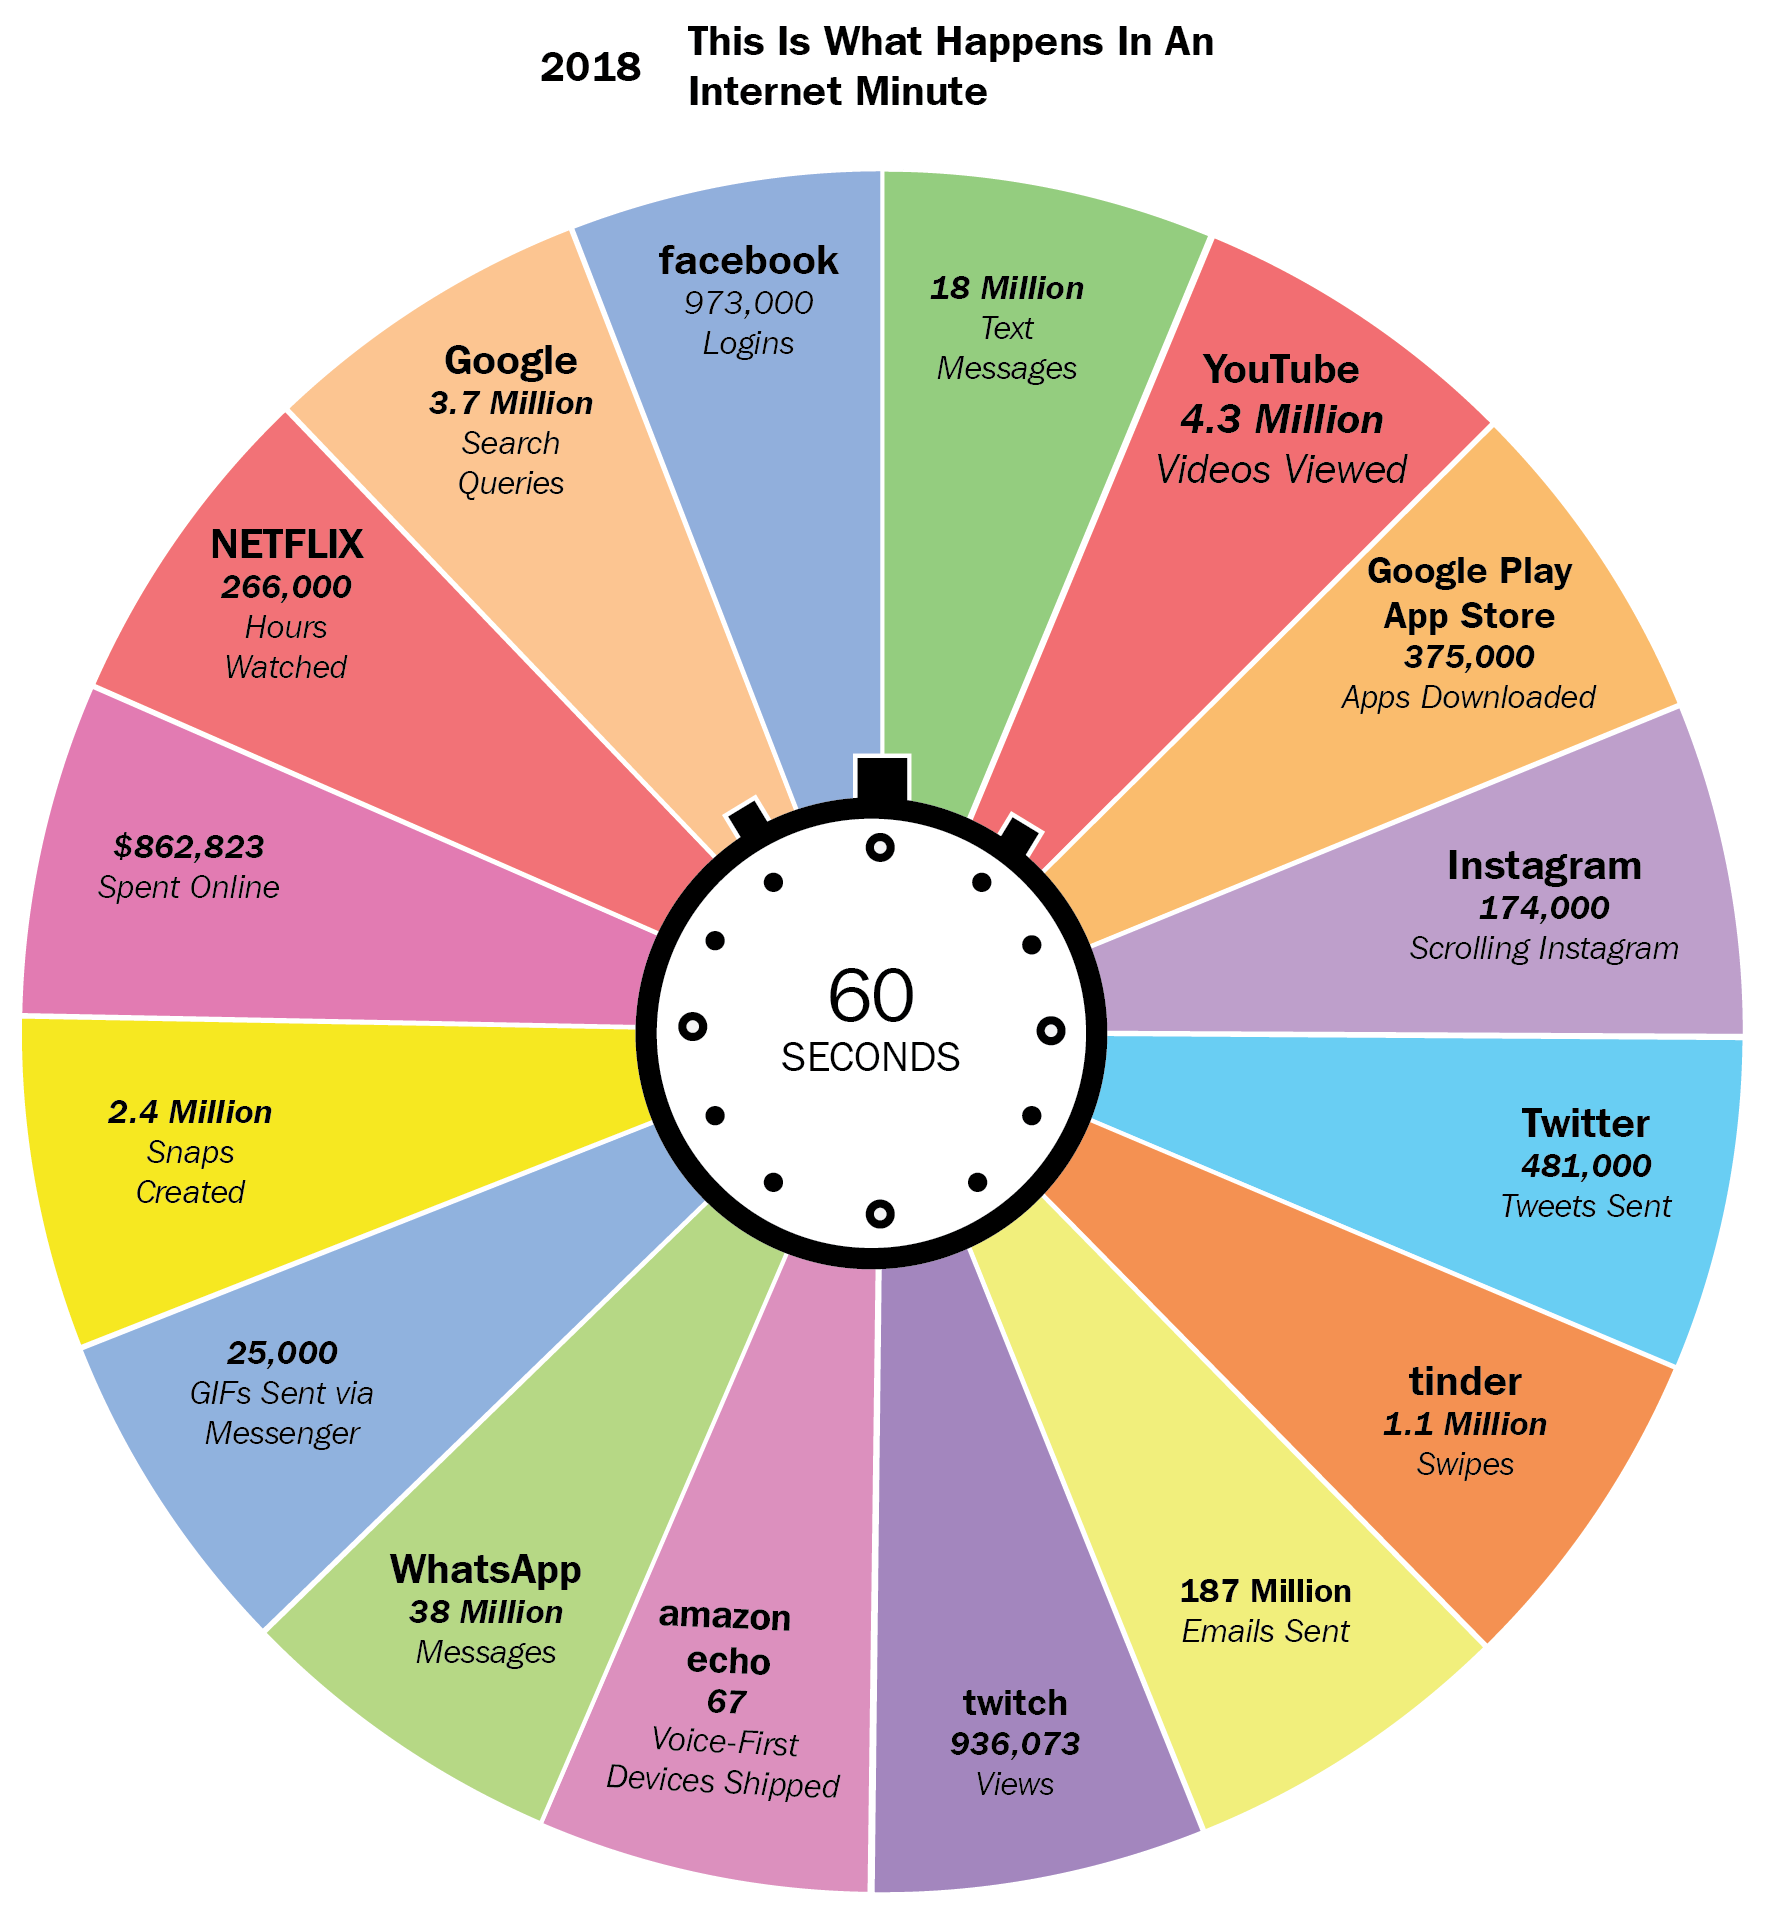
To get data from the internet, there are multiple options, as shown in the following list:
- Bulk downloads from websites such as Wikipedia, IMDb, and the Million Song Dataset (which can be found here: https://labrosa.ee.columbia.edu/millionsong/).
- Accessing the data through APIs (such as Google, Twitter, Facebook, and YouTube).
- It is okay to scrape public, non-sensitive, and anonymized data. Be sure to check the terms and conditions and to fully reference the information.
The main drawbacks of the data collected is that it takes time and space to accumulate the data, and it covers only what happened; for instance, intentions and internal and external motivations are not collected. Finally, such data might be noisy, incomplete, inconsistent, and may even change over time.
Another option is to collect measurements from sensors such as inertial and location sensors in mobile devices, environmental sensors, and software agents monitoring key performance indicators.
Generating data
An alternative approach is to generate the data by you, for example, with a survey. In survey design, we have to pay attention to data sampling; that is, who the respondents are that are answering the survey. We only get data from the respondents who are accessible and willing to respond. Also, respondents can provide answers that are in line with their self-image and researcher's expectations.
Alternatively, the data can be collected with simulations, where a domain expert specifies the behavior model of users at a micro level. For instance, crowd simulation requires specifying how different types of users will behave in a crowd. Some of the examples could be following the crowd, looking for an escape, and so on. The simulation can then be run under different conditions to see what happens (Tsai et al., 2011). Simulations are appropriate for studying macro phenomena and emergent behavior; however, they are typically hard to validate empirically.
Furthermore, you can design experiments to thoroughly cover all of the possible outcomes, where you keep all of the variables constant and only manipulate one variable at a time. This is the most costly approach, but usually provides the best quality.
Sampling traps
Data collection may involve many traps. To demonstrate one, let me share a story. There is supposed to be a global, unwritten rule for sending regular mail between students for free. If you write student to student in the place where the stamp should be, the mail is delivered to the recipient for free. Now, suppose Jacob sends a set of postcards to Emma, and given that Emma indeed receives some of the postcards, she concludes that all of the postcards are delivered and that the rule indeed holds true. Emma reasons that, as she received the postcards, all of the postcards are delivered. However, she does not know of the postcards that were sent by Jacob, but were undelivered; hence, she is unable to account for this in her inference. What Emma experienced is survivorship bias; that is, she drew the conclusion based on the data that survived. For your information, postcards that are sent with a student to student stamp get a circled black letter T stamp on them, which mean postage is due and the receiver should pay it, including a small fine. However, mail services often have higher costs on applying such fees and hence do not do it. (Magalhães, 2010).
Another example is a study that found that the profession with the lowest average age of death was student. Being a student does not cause you to die at an early age; rather, being a student means you are young. This is why the average is so low. (Gelman and Nolan, 2002).
Furthermore, a study that found that only 1.5% of drivers in accidents reported they were using a cell phone, whereas 10.9% reported another occupant in the car distracted them. Can we conclude that using a cell phone is safer than speaking with another occupant? (Uts, 2003) To answer this question, we need to know the prevalence of the cell phone use. It is likely that a higher number of people talked to another occupant in the car while driving than talked on a cell phone during the period when the data was collected.