


Creating and running the simplest app
Using the structure that we just discussed, and excluding callback functions, let's now build our first simple app!
Create a file and name it app.py, and write the following code:
- Import the required packages using their usual aliases:
import dash
import dash_html_components as html
- Create (instantiate) the app:
app = dash.Dash(__name__)
- Create the app's layout:
app.layout = html.Div([ html.H1('Hello, World!') ]) - Run the app:
if __name__ == '__main__':
    app.run_server(debug=True)
A few points before running the app. First, I strongly suggest that you don't copy and paste code. It's important to make sure you remember what you coded. It's also useful to explore the possibilities provided by each component, class, or function. Most IDEs provide hints on what is possible.
This app's layout contains one element, which is the list passed to html.Div, corresponding to its children parameter. This will produce an H1 element on the page. Finally, note that I set debug=True in the app.run_server method. This activates several developer tools that are really useful while developing and debugging.
You are now ready to run your first app. From the command line, in the same folder where you saved your app file, run this:
python app.py
You might need to run the preceding command using python3 if your system is not configured to use version three by default:
python3 app.py
You should now see an output like that shown in Figure 1.3, indicating that the app is running:
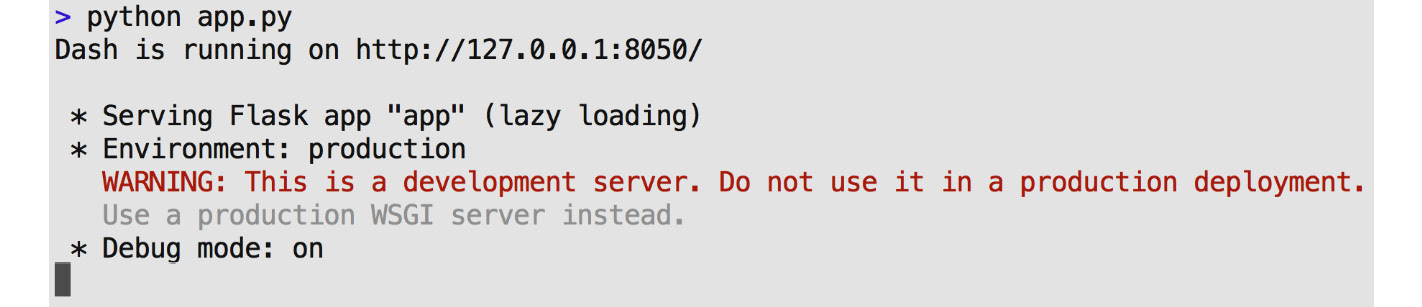
Figure 1.3 – Command-line output while running the app
Congratulations on running your very first Dash app! Now, if you point your browser to the URL shown in the output, http://127.0.0.1:8050, you should see the "Hello, World!" message in H1 on the page. As you can see, it shows that it is serving a Flask app called "app," with a warning that this server is not designed for production use. We will cover deployment in a later chapter, but this server is good enough for developing and testing your apps. You can also see that we are in debug mode:
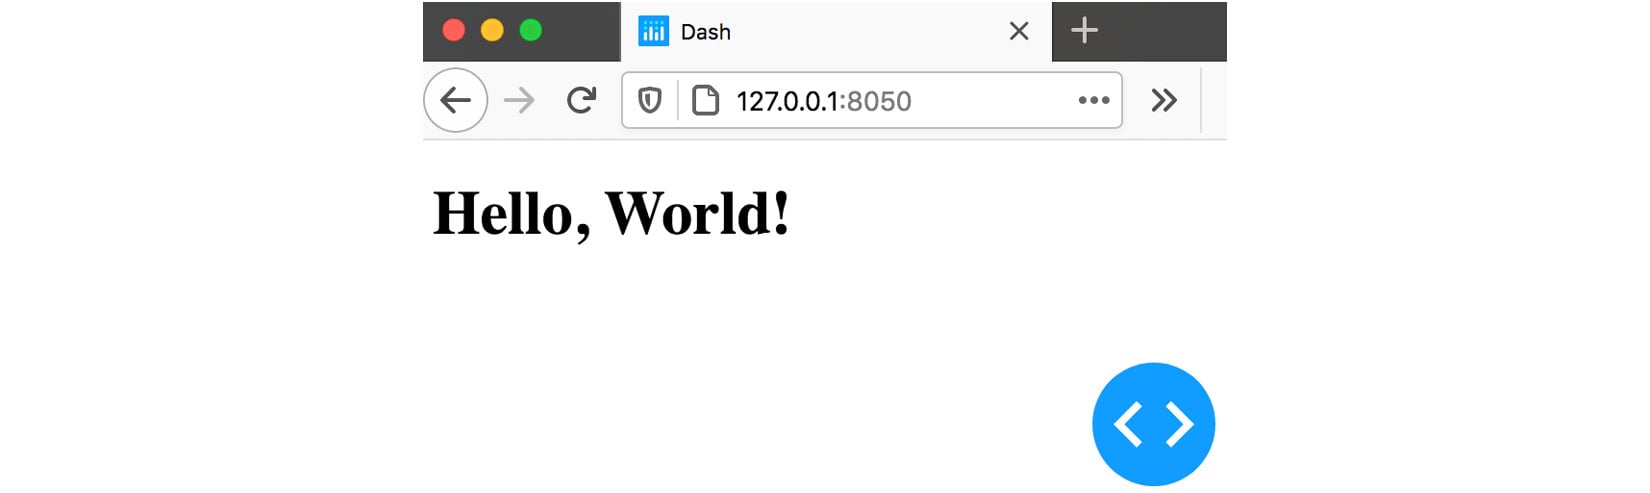
Figure 1.4 – App rendered in the browser
As specified, we see the text in H1, and we can also see the blue button as well. Clicking on this button will open some options in the browser, and it will be more useful once there are callback functions and/or errors while running the app. We wouldn't have gotten the blue button if we had run the app with debug=False, which is the default.
Now that we have established a good-enough understanding of the main elements that go into creating a Dash app, and we have run a minimal one, we are ready to explore two packages that are used for adding and managing visible elements: first, Dash HTML Components, and after that, we will explore how to use Dash Bootstrap Components.


