Computing autocorrelation
This recipe guides you through the process of computing autocorrelation. Autocorrelation is a measure of the correlation between a time series and itself at different lags, and it is helpful to understand the structure of time series, specifically, to quantify how past values affect the future.
Getting ready
Correlation is a statistic that measures the linear relationship between two random variables. Autocorrelation extends this notion to time series data. In time series, the value observed in a given time step will be similar to the values observed before it. The autocorrelation function quantifies the linear relationship between a time series and a lagged version of itself. A lagged time series refers to a time series that is shifted over a number of periods.
How to do it…
We can compute the autocorrelation function using statsmodels:
from statsmodels.tsa.stattools import acf
acf_scores = acf(x=series_daily, nlags=365)
The inputs to the function are a time series and the number of lags to analyze. In this case, we compute autocorrelation up to 365 lags, a full year of data.
We can also use statsmodels to compute the partial autocorrelation function. This measure extends the autocorrelation by controlling for the correlation of the time series at shorter lags:
from statsmodels.tsa.stattools import pacf
pacf_scores = pacf(x=series_daily, nlags=365)
The statsmodels library also provides functions to plot the results of autocorrelation analysis:
from statsmodels.graphics.tsaplots import plot_acf, plot_pacf
plot_acf(series_daily, lags=365)
plot_pacf(series_daily, lags=365)
How it works…
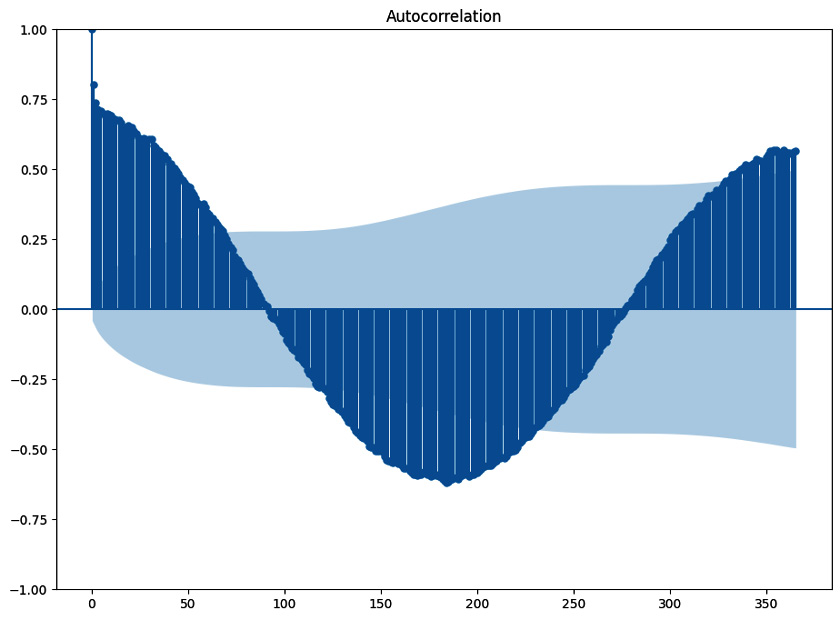
The following figure shows the autocorrelation of the daily solar radiation time series up to 365 lags.

Figure 1.4: Autocorrelation scores up to 365 lags. The oscillations indicate seasonality
The oscillations in this plot are due to the yearly seasonal pattern. The analysis of autocorrelation is a useful approach to detecting seasonality.
There’s more…
The autocorrelation at each seasonal lag is usually large and positive. Besides, sometimes autocorrelation decays slowly along the lags, which indicates the presence of a trend. You can learn more about this from the following URL: https://otexts.com/fpp3/components.html.
The partial autocorrelation function is an important tool for identifying the order of autoregressive models. The idea is to select the number of lags whose partial autocorrelation is significant.


