
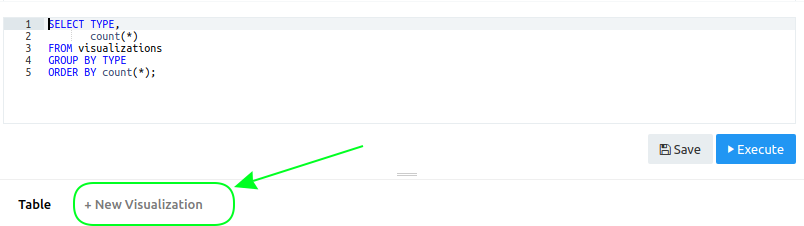
After we have saved the query (and given it a meaningful name instead of New Query; in our case, it's visualizations_by_type), we can create a visualization for it.
From within the query source (if you're not in query edit mode, click on Edit Source), click on +New visualization:
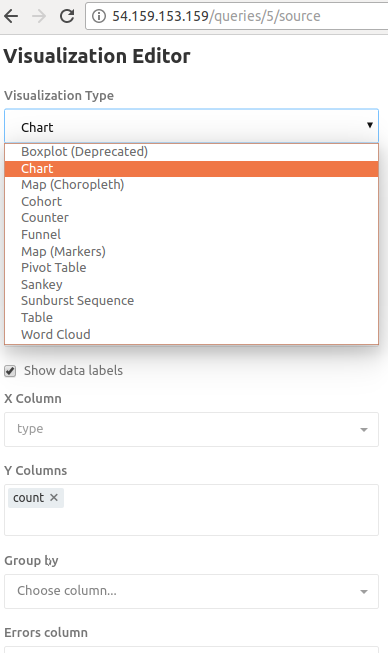
You will see the Visualization Editor window, where you can the Visualization Type (and optionally give your visualization a name):
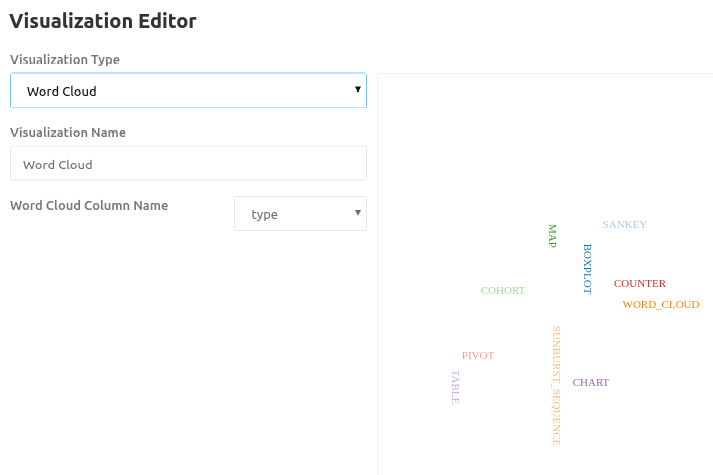
Here is an example of Word Cloud, which is a Visualization Type (as you can see, you only need to provide the column from which the Word Cloud is generated):
And here is a much more classic visualization of the chart. Note that this is in preview mode, so the visualization is changed automatically after you select a different type. However, it's not...