Monitoring app performance
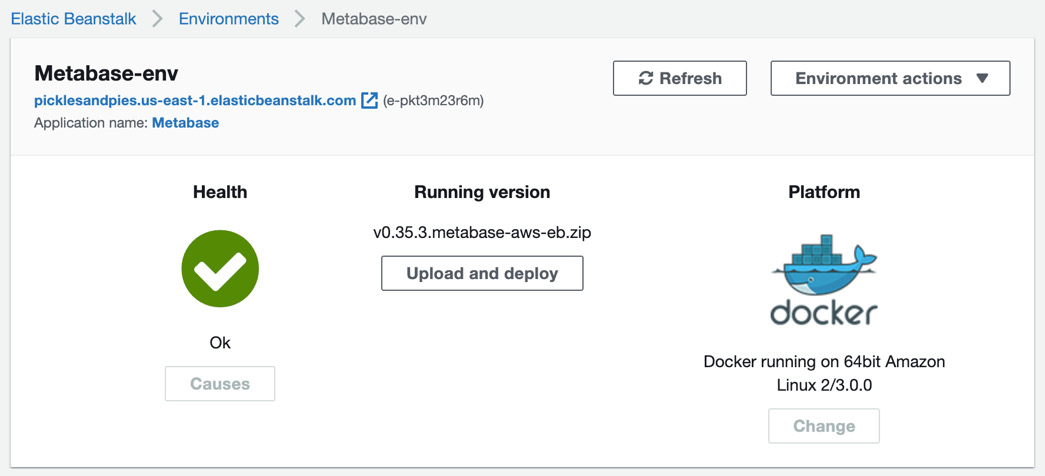
On the Elastic Beanstalk dashboard, we can see the overall health of our environment. Most of the time it should have the green checkmark, as in Figure 2.11. If you deploy using the smaller t2.micro EC2 instances, it may occasionally be in the Warning state (although I've noticed the actual app works fine in those cases):

Figure 2.12 -
In addition to the overall health check, we can drill into specific performance-related statistics around the resources we've deployed. Let's learn how to do that.
From the Elastic Beanstalk dashboard, click Monitoring on the left rail. This will bring up the performance monitoring overview, where you can view several high-level statistics about your app.
Rather than going over all the statistics presented on the dashboard, let's just learn how to create a chart of the average NetworkOut for our EC2 Instances. Recall that in the Scaling Triggers section of our environment...


