The Search & Reporting app (or just the search app) is where most actions in Splunk start. This app is a dashboard where you will begin your searching.
The Search & Reporting app
Data generator
If you want to follow the examples that appear in the next few chapters, install the ImplementingSplunkDataGenerator demo app by following these steps:
- Download ImplementingSplunkDataGenerator.tar.gz from the code bundle available at http://www.packtpub.com/support
- Choose Manage apps... from the Apps menu
- Click on the button labeled Install app from the file
- Click on Choose File, select the file, and then click on Upload
This data generator app will produce about 16 megabytes of output per day. The app can be disabled so that it stops producing data by using Manage apps... under the App menu.
The Summary view
Within the Search & Reporting app, the user is presented with the Summary view, which contains information about the data that the user searches by default. This is an important distinction; in a mature Splunk installation, not all users will always search all data by default. But if this is your first trip into Search & Reporting, you'll see the following:
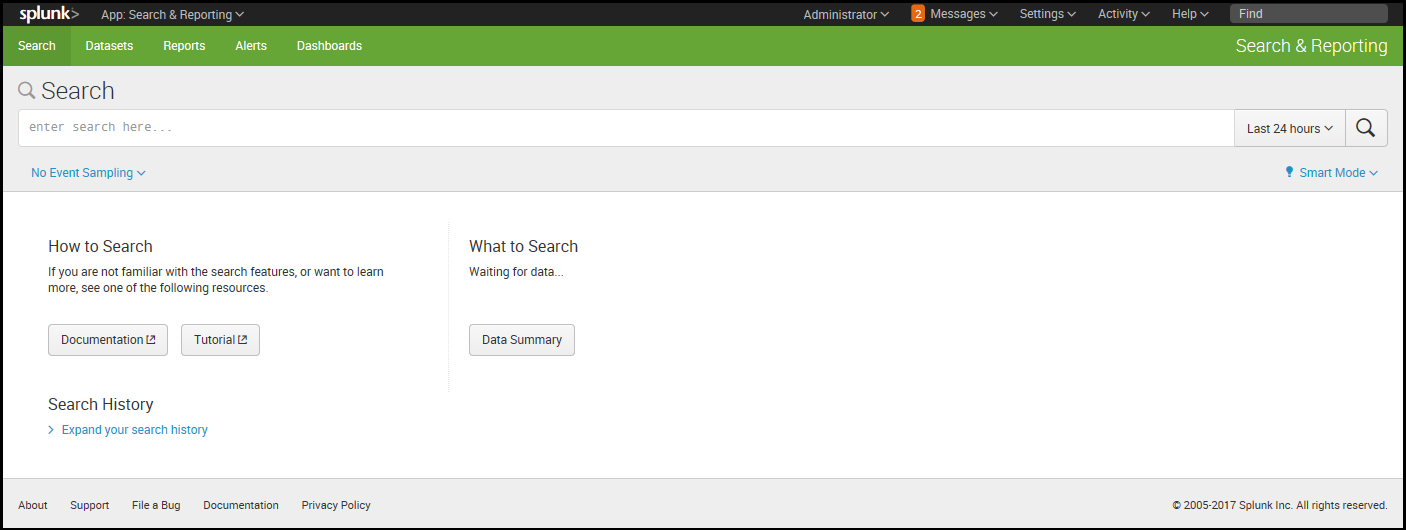
From the screen depicted in the previous screenshot, you can access the Splunk documentation related to What to Search and How to Search. Once you have at least some data indexed (a topic we'll discuss later), Splunk will provide some statistics on the available data under What to Search.
What to Search is shown in the following screenshot:
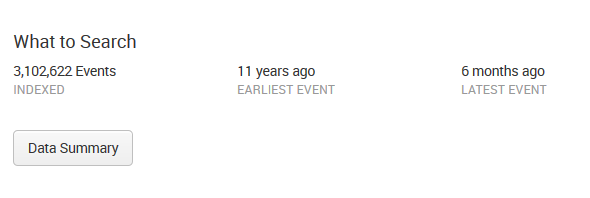
In previous versions of Splunk, panels such as the All indexed data panel provided statistics for a user's indexed data. Other panels gave a breakdown of data using three important pieces of metadata—Source, Sourcetype, and Hosts. In the current version, 7.0.0, you access this information by clicking on the button labeled Data Summary, which presents the following to the user:

This dialog splits the information into three tabs—Hosts, Sources and Sourcetypes:
- A host is a captured hostname for an event. The majority of cases, the host field is set to the name of the machine where the data originated. There are cases where this is not known, so the host can also be configured arbitrarily.
- A source in Splunk is a unique path or name. In a large installation, there may be thousands of machines submitting data, but all data on the same path across these machines counts as one source. When the data source is not a file, the value of the source can be arbitrary. For instance, the name of a script or network port.
- A source type is an arbitrary categorization of events. There may be many sources across many hosts in the same source type. For instance, given the sources /var/log/access.2012-03-01.log and /var/log/access.2012-03-02.log on the hosts fred and wilma, you could reference all these logs with source type access or any other name that you like.
Let's move on now and discuss each of the Splunk widgets (just below the app name). The first widget is the navigation bar:

As a general rule, within Splunk, items with downward triangles are menus. Items without a downward triangle are links.
We will cover customizing the navigation bar in Chapter 8, Working with Apps.
Next, we find the Search bar. This is where the magic starts. We'll go into great detail shortly:

Search
Okay, we've finally made it to search. This is where the real power of Splunk lies.
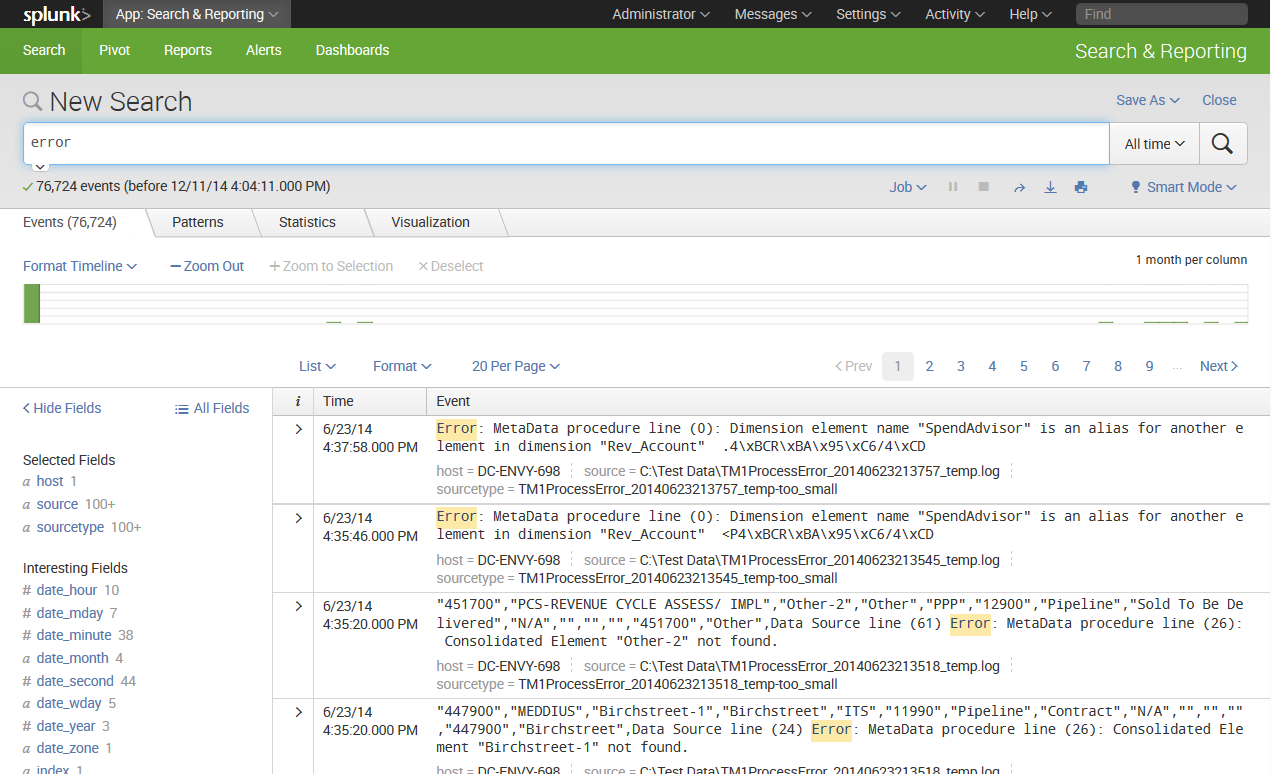
For our first search, we will search for the word (not case-specific) error. Click in the search bar, type the word error, and then either press Enter or click on the magnifying glass to the right of the bar:

Upon initiating the search, we are taken to the search results page (which hasn't really changed in version 7.0):
However, since the data is randomly generated, not all queries will work as expected and you may have to modify them accordingly.
You can find the steps to upload the datasets in the previous Data generator section.
Refer to the Using the time picker section for details on changing the time frame of your search.
Actions
Let's inspect the elements on this page. Below the Search bar, we have the event count, action icons, and menus:

Starting from the left, we have the following:
- The number of events matched by the base search. Technically, this may not be the number of results pulled from disk, depending on your search. Also, if your query uses commands, this number may not match what is shown in the event listing.
- Job: It opens the Search job inspector window, which provides very detailed information about the query that was run.
- Pause: It causes the current search to stop locating events but keeps the job open. This is useful if you want to inspect the current results to determine whether you want to continue a long-running search.
- Stop: This stops the execution of the current search but keeps the results generated so far. This is useful when you have found enough and want to inspect or share the results found so far.
- Share: It shares the search job. This option extends the job's lifetime to seven days and sets the read permissions to everyone.
- Print: This formats the page for printing and instructs the browser to print.
- Export: It exports the results. Select this option to output to CSV, raw events, XML, or JavaScript Object Notation (JSON) and specify the number of results to export.
- Smart mode: This controls the search experience. You can set it to speed up searches by cutting down on the event data it returns and additionally by reducing the number of fields that Splunk will extract by default from the data (Fast mode). You can otherwise set it to return as much event information as possible (Verbose mode). In Smart mode (the default setting), it toggles search behavior based on the type of search you're running.
Timeline
Now we'll skip to the timeline below the action icons:

Along with providing a quick overview of the event distribution over a period of time, the timeline is also a very useful tool for selecting sections of time. Placing the pointer over the timeline displays a popup for the number of events in that slice of time. Clicking on the timeline selects the events for a particular slice of time.
Clicking and dragging selects a range of time:

Once you have selected a period of time, clicking on Zoom to selection changes the time frame and reruns the search for that specific slice of time. Repeating this process is an effective way to drill down to specific events.
Deselect shows all events for the time range selected in the time picker.
Zoom out changes the window of time to a larger period around the events in the current time frame.
The field picker
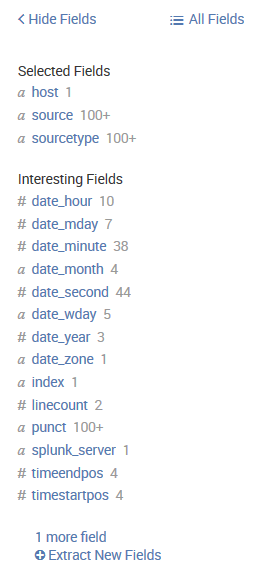
To the left of the search results, we find the field picker. This is a great tool for discovering patterns and filtering search results:
Fields
The field list contains two lists.
- Selected Fields, which have their values displayed under the search event in the search results
- Interesting Fields, which are other fields that Splunk has picked out for you
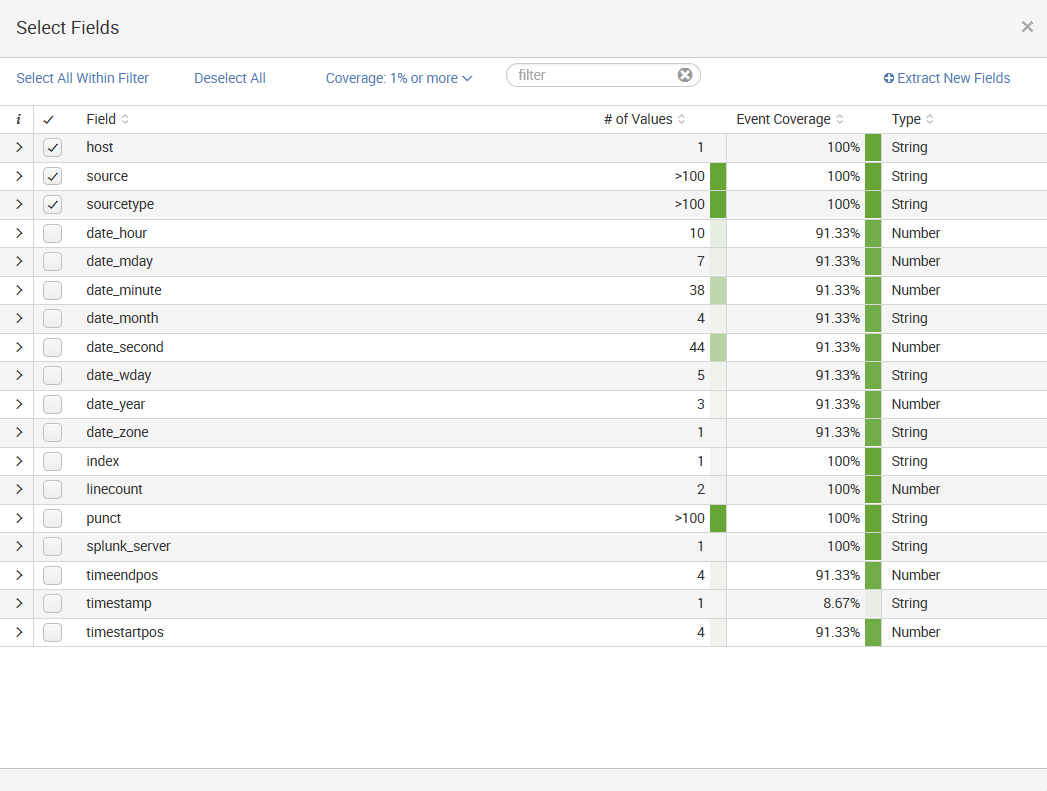
Above the field list are two links, Hide Fields and All Fields:
- Hide Fields: Hides the field list area from the view
- All Fields: Takes you to the Selected Fields window:
Search results
We are almost through with all the widgets on the page. We still have a number of items to cover in the search results section, though, just to be thorough:
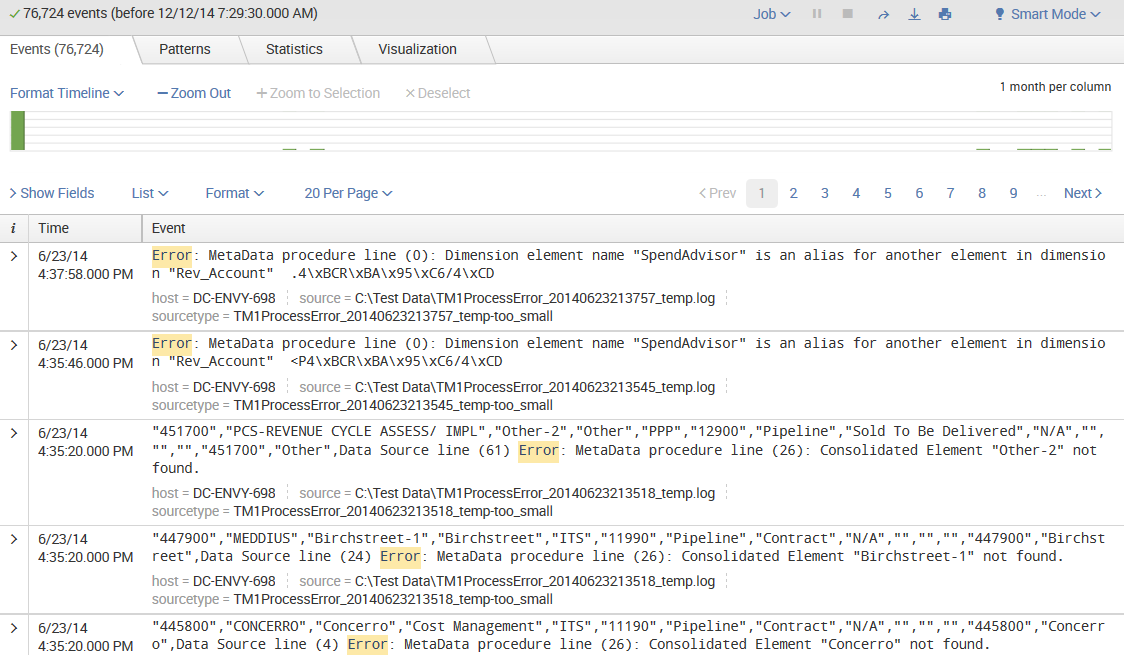
As you can see in the previous screenshot, at the top of this section, we have the number of events displayed. When viewing all results in their raw form, this number will match the number above the timeline. This value can be changed either by making a selection on the timeline or by using other search commands.
Next, we have the action icons (described earlier) that affect these particular results.
Under the action icons, we have four results tabs:
- Events list, which will show the raw events. This is the default view when running a simple search, as we have done so far.
- Patterns streamlines event pattern detection. A list of the most common patterns among the set of events is returned by your search. A number of events that share a similar structure are represented by these patterns.
- Statistics populates when you run a search with transforming commands such as stats, top, chart, and so on. The previous keyword search for error does not display any results in this tab because it does not have any transforming commands.
- Visualization transforms searches and also populates the Visualization tab. The results area of the Visualization tab includes a chart and the statistics table used to generate the chart. Not all searches are eligible for visualization—a concept which will be covered later in this book.
Under the previously described tabs, is the timeline that we will cover in more detail later in this chapter.
Options
Beneath the timeline (starting from the left) is a row of option links, including:
- Show Fields: Shows the Selected Fields screen
- List: Allows you to select an output option (Raw, List, or Table) for displaying the search result
- Format: Provides the ability to set Result display options, such as Show row numbers, Wrap results, the Max lines (to display) and Drilldown as on or off
- NN Per Page: This is where you can indicate the number of results to show per page (10, 20, or 50)
To the right are options that you can use to choose a page of results, and to change the number of events per page.
Events viewer
Finally, we make it to the actual events. Let's examine a single event:

Starting from the left, we have:
- Event Details: Clicking here (indicated by the right facing arrow) opens the selected event, provides specific information about the event by type, field, and value, and allows you the ability to perform specific actions on a particular event field. In addition, Splunk offers a button labeled Event Actions to access workflow actions, a few of which are always available.
- Build Event Type: Event types are a way to name events that match a certain query. We will dive into event types in Chapter 7, Extending Search.
- Extract Fields: This launches an interface for creating custom field extractions. We will cover field extraction in Chapter 3, Tables, Charts, and Fields.
- Show Source: This pops up a window with a simulated view of the original source.
- The event number: Raw search results are always returned in the order most recent first.
- Next appear any workflow actions that have been configured. Workflow actions let you create new searches or links to other sites, using data from an event. We will discuss workflow actions in Chapter 7, Extending Search.
- Next comes the parsed date from this event, displayed in the time zone selected by the user. This is an important and often confusing distinction. In most installations, everything is in one time zone—the servers, the user, and the events. When one of these three things is not in the same time zone as the others, things can get confusing. We will discuss time in great detail in Chapter 2, Understanding Search.
- Next, we see the raw event itself. This is what Splunk saw as an event. With no help, Splunk can do a good job finding the date and breaking lines appropriately; but as we will see later, with a little help, event parsing can be more reliable and more efficient.
- Below the event are the fields that were selected in the field picker. Clicking on the value adds the field value to the search.


