Debugging a Shiny app is not the same as debugging code in other programming languages, such as C, C++, or Java, where the control flow looks linear. Because RShiny is reactive, it runs on a web server as well as a Shiny framework. That makes it harder to debug.
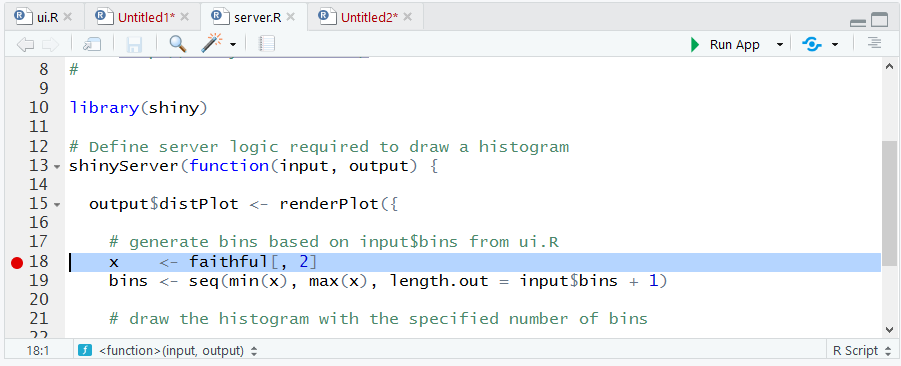
If we get an error or an undesirable output, we can apply break points at the suspected line of code. This can be done by clicking on the left side of the code where the line number is given, which makes a red dot appear:

After running the code, Shiny will stop execution at the breakpoint and we can step into the code and take a look at the current variable values. Setting a breakpoint is possible with RStudio.
Sometimes, applying a breakpoint doesn't work, so we have to change the input and observe the output. We can then apply a break point again to try to diagnose the problem. We can enable the showcase...


