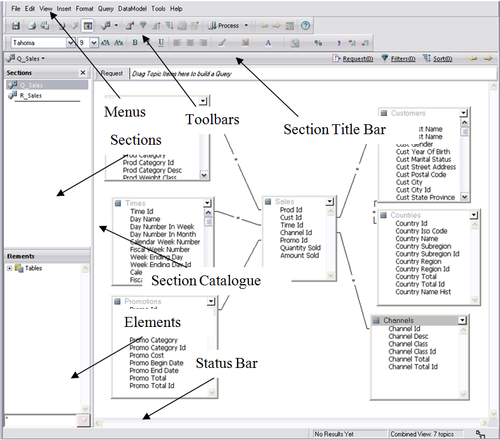
The Web Client interface
Understanding the Web Client interface is crucial to being proficient in the product. The different sections of the software contain a variety of different options, but the location of where to find and utilize these options is the same across the tool. Knowledge of the interface and how to leverage the features of each section is key to unlock the full potential of the product.
The sections of an Interactive Reporting document are the different objects in the software used to aid in querying, analyzing, or displaying information. There are seven types of unique sections. The specifics of each section will be addressed in the following chapters:
The Query section is the main section used to setup and execute a query from a relational or multi-dimensional database.
Each Query section is accompanied by a Results section where the data returned from the Query is displayed and can be manipulated.
The Table section is similar to the Results section and is used to manipulate and split a dataset into different subsets for analysis.
The Pivot section is specific to a Results or Table section, and is used to graphically display data in pivot table format—similar to Microsoft Excel Pivots.
The Chart section is also specific to a Results or Table section and is used to display data in a chart.
The Report section provides the ability to present pivots, charts, and tables of data in a well formatted document.
Dashboards are used to create custom interfaces or interactive displays of key metrics.
The following screenshot displays the Interactive Reporting Web Client window open to the Query section. The arrows shown in the screenshot highlight each of the different features and toolbars of the product. These different features and toolbars can be toggled on and off using the View menu:

The Section Catalogue
The Section Catalogue, displayed on the left of the previous screenshot, contains two windows for navigating and editing sections. The Sections window displays the different sections in the document, and the Elements window is used to add content to a section. Both windows are used commonly when building documents and performing analysis.
Menus
The Interactive Reporting Web Client Menus are similar to a typical menu structure seen in most Windows-based applications. Interactive Reporting contains a standard set of menus and each section also contains menus specific to a section. The details of the section-specific menu items will be discussed in each respective chapter. The following menu items are consistent between all product sections:
The File menu provides the features for managing the document, including the ability to save documents both to the local drive and to the Workspace, the ability to import external data, and the ability to export and print content.
The Edit menu contains the general options for managing sections. These features include the standard copy and paste options, but also include the ability to delete, rename, and duplicate sections.
The View menu contains the features for managing the different windows and views of the document, including showing/hiding windows and displaying query-specific information.
The Insert menu is used to add a new section into the document.
The Format menu is used to format the display of sections, including font, color, size, type, and other common formatting options.
The Tools menu provides the ability to execute queries and manage default and program options.
The Help menu contains the help contents, links, and information about the product version.
These menu items are shown in the following screenshot:

Toolbars
The Interactive Reporting Web Client contains three standard toolbars used to manage views, content, and formatting. The toolbars are turned on and off through the View menu. To show or hide a toolbar from the viewing area, go to View Menu | Toolbars, and then click on the toolbar name to show or hide it. A checkbox next to the toolbar signifies the toolbar is shown in the viewing area. The following is a description of each of the three toolbars:
The Standard toolbar contains shortcuts to the common standard features of the tool including saving, printing, inserting, and query processing.

The Formatting toolbar contains controls to manage fonts, backgrounds, and number formats.

The Section toolbar only applies to the Dashboard, Report, and Chart sections, and is used to modify and control object layouts and chart types.

Section Title Bar
The Section Title Bar has two different purposes. The bar contains a navigation drop-down on the left of the bar, and it contains section-specific controls on the right-side of the bar which is used to toggle options on and off. These options are specific to each section and are used to build queries, add content to a section, or to sort content. When these options are toggled on, the options will be displayed at the top or bottom of the main content window. The individual chapters for each section provide a breakdown of the different options included in the Section Title Bar.
Status Bar
The Status Bar is shown at the bottom of the Web Client interface and contains information on a specific section. The information provided in the Status Bar includes the number of rows returned from a query, the number of rows shown in a results set, the number of rows and columns in a pivot table, the number of report pages, and the zoom settings on the dashboard.


