TensorBoard
TensorFlow includes functions to debug and optimize programs in a visualization tool called TensorBoard. Using TensorBoard, you can observe different types of statistics concerning the parameters and details of any part of the graph computing graphically.
Moreover, while doing predictive modeling using the complex deep neural network, the graph can be complex and confusing. Thus to make it easier to understand, debug, and optimize TensorFlow programs, you can use TensorBoard to visualize your TensorFlow graph, plot quantitative metrics about the execution of your graph, and show additional data such as images that pass through it.
Therefore, the TensorBoard can be thought of as a framework designed for analysis and debugging of predictive models. TensorBoard uses the so-called summaries to view the parameters of the model: once a TensorFlow code is executed, we can call TensorBoard to view summaries in a GUI.
How Does TensorBoard Work?
As explained previously, TensorFlow uses the computation graph to execute an application, where each node represents an operation and the arcs are the data between operations.
The main idea in TensorBoard is to associate the so-called summary with nodes (operations) of the graph. Upon running the code, the summary operations will serialize the data of the node that is associated with it and output the data into a file that can be read by TensorBoard. Then TensorBoard can be run and visualize the summarized operations. The workflow when using TensorBoard is:
- Build your computational graph/code
- Attach summary ops to the nodes you are interested in examining
- Start running your graph as you normally would
- Additionally, run the summary ops
- When the code is done running, run TensorBoard to visualize the summary outputs
If you type $ which tensorboard in your terminal, it should exist if you installed with pip:
asif@ubuntu:~$ which tensorboard
/usr/local/bin/tensorboard
You need to give it a log directory, so you are in the directory where you ran your graph; you can launch it from your terminal with something like:
tensorboard --logdir .
Then open your favorite web browser and type in localhost:6006 to connect. When TensorBoard is fully configured, this can be accessed by issuing the following command:
$ tensorboard –logdir=<trace_file_name>
Now you simply need to access the local port 6006 from the browser http://localhost:6006/. Then it should look like this:
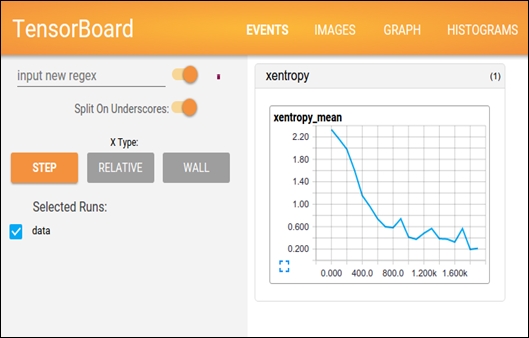
Figure 11: Using TensorBoard on browser
Is this already too much? Don't worry, in the last section, we'll combine all the ideas previously explained to build a single input neuron model and to analyze it with TensorBoard.


