Extended events
We briefly introduced extended events in the previous chapter to show you how to capture execution plans. In this section, we’ll gain more information about this feature, which was introduced with SQL Server 2008. There is another important reason for this: as of SQL Server 2012, SQL Trace has been deprecated, making extended events the tool of choice to provide debugging and diagnostic capabilities in SQL Server. Although explaining extended events in full detail is beyond the scope of this book, this section will give you enough background to get started using this feature to troubleshoot your queries.
In this section, you will be introduced to the basic concepts surrounding extended events, including events, predicates, actions, targets, and sessions. Although we mainly use code for the examples in this book, it is worth showing you the new extended events graphical user interface too, which is useful if you are new to this technology and can also help you script the definition of extended events sessions in pretty much the same way we use Profiler to script a server trace. The extended events graphical user interface was introduced in SQL Server 2012.
One of my favorite things to do with SQL Trace – and now with extended events – is to learn how other SQL Server tools work. You can run a trace against your instance and run any one of the tools to capture all the T-SQL statements sent from the tool to the database engine. For example, I recently troubleshooted a problem with Replication Monitor by capturing all the code this tool was sending to SQL Server. Interestingly, the extended events graphical user interface is not an exception, and you can use it to see how the tool itself works. When you start the tool, it loads all the required extended events information. By tracing it, you can see where the information is coming from. You don’t have to worry about this for now as we will cover it next.
Extended events are designed to have a low impact on server performance. They correspond to well-known points in the SQL Server code, so when a specific task is executing, SQL Server will perform a quick check to find out if any sessions have been configured to listen to this event. If no sessions are active, the event will not fire, and the SQL Server task will continue with no overhead. If, on the other hand, there are active sessions that have the event enabled, SQL Server will collect the required data associated with the event. Then, it will validate the predicate, if any, that was defined for the session. If the predicate evaluates to false, the task will continue with minimal overhead. If the predicate evaluates to true, the actions defined in the session will be executed. Finally, all the event data is collected by the defined targets for later analysis.
You can use the following statement to find out the list of events that are available on the current version of SQL Server. You can create an extended events session by selecting one or more of the following events:
SELECT name, description
FROM sys.dm_xe_objects
WHERE object_type = 'event' AND
(capabilities & 1 = 0 OR capabilities IS NULL)
ORDER BY name
Note that 2,408 events are returned with SQL Server 2022 CTP 2.0, including sp_statement_completed, sql_batch_completed, and sql_statement_completed, which we will discuss later.
Each event has a set of columns that you can display by using the sys.dm_xe_object_columns DMV, as shown in the following code:
SELECT o.name, c.name as column_name, c.description
FROM sys.dm_xe_objects o
JOIN sys.dm_xe_object_columns c
ON o.name = c.object_name
WHERE object_type = 'event' AND
c.column_type <> 'readonly' AND
(o.capabilities & 1 = 0 OR o.capabilities IS NULL)
ORDER BY o.name, c.name
An action is a programmatic response to an event and allows you to execute additional code. Although you can use actions to perform operations such as capturing a stack dump or inserting a debugger break into SQL Server, most likely, they will be used to capture global fields that are common to all the events, such as plan_handle and database_name. Actions are also executed synchronously. You can run the following code to find the entire list of available actions:
SELECT name, description
FROM sys.dm_xe_objects
WHERE object_type = 'action' AND
(capabilities & 1 = 0 OR capabilities IS NULL)
ORDER BY name
Predicates are used to limit the data you want to capture, and you can filter against event data columns or any of the global state data returned by the following query:
SELECT name, description
FROM sys.dm_xe_objects
WHERE object_type = 'pred_source' AND
(capabilities & 1 = 0 OR capabilities IS NULL)
ORDER BY name
The query returns 50 values, including database_id, session_id, and query_hash. Predicates are Boolean expressions that evaluate to either true or false, and they also support short-circuiting, in which an entire expression will evaluate to false as soon as any of its predicates evaluates to false.
Finally, you can use targets to specify how you want to collect the data for analysis; for example, you can store event data in a file or keep it in the ring buffer (a ring buffer is a data structure that briefly holds event data in memory in a circular way). These targets are named event_file and ring_buffer, respectively. Targets can consume event data both synchronously and asynchronously, and any target can consume any event. You can list the six available targets by running the following query:
SELECT name, description
FROM sys.dm_xe_objects
WHERE object_type = 'target' AND
(capabilities & 1 = 0 OR capabilities IS NULL)
ORDER BY name
We will cover how to use all these concepts to create event sessions later in this chapter, but first, we will check out how to find the names of events you may be already familiar with when using SQL Trace.
Mapping SQL Trace events to extended events
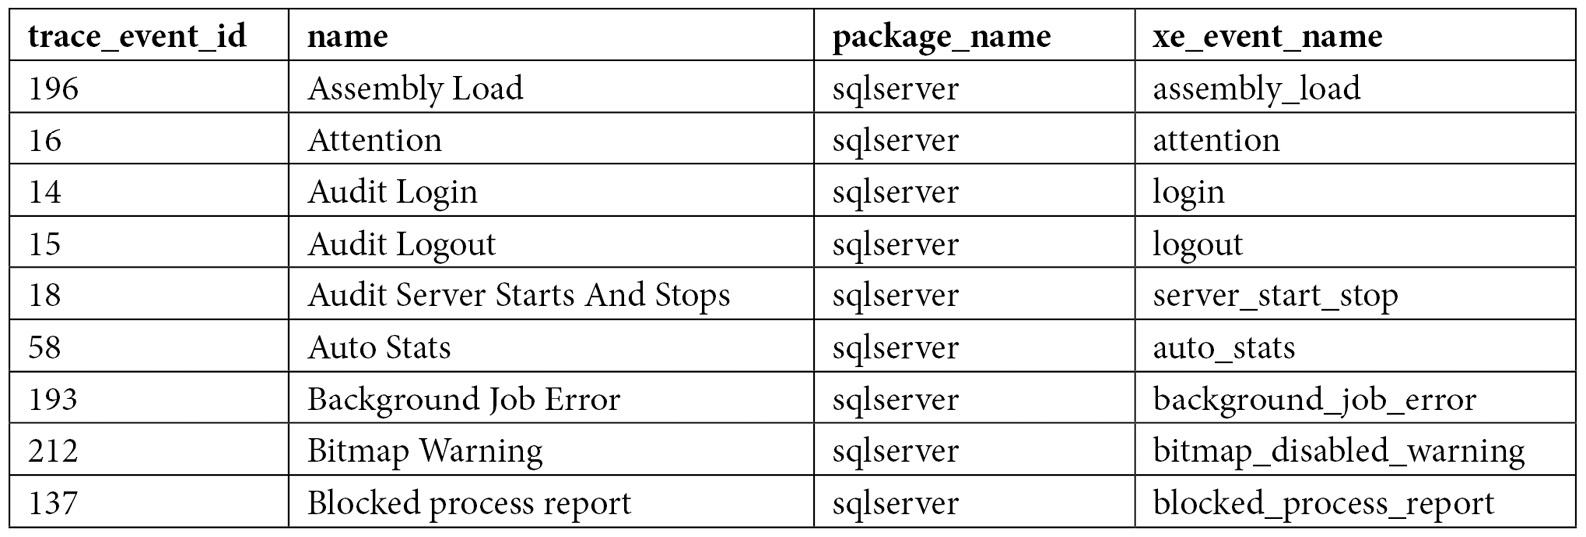
You are probably already familiar with some SQL Trace events or even have trace definitions already configured in your environment. You can use the sys.trace_xe_event_map extended events system table to help you map SQL Trace event classes to extended events. sys.trace_xe_event_map contains one row for each extended event that is mapped to a SQL Trace event class. To see how it works, run the following query:
SELECT te.trace_event_id, name, package_name, xe_event_name
FROM sys.trace_events te
JOIN sys.trace_xe_event_map txe ON te.trace_event_id = txe.trace_event_id
WHERE te.trace_event_id IS NOT NULL
ORDER BY name
The query returns 139 records, some of which are shown here:
In addition, you can use the sys.trace_xe_event_map system table in combination with the sys.fn_trace_geteventinfo function to map the events that have been configured on an existing trace to extended events. The sys.fn_trace_geteventinfo function returns information about a trace currently running and requires its trace ID. To test it, run your trace (explained previously) and run the following statement to get its trace ID. trace_id 1 is usually the default trace. You can easily identify your trace by looking at the path column on the output, where NULL is shown if you are running a Profiler trace:
SELECT * FROM sys.traces
Once you get the trace ID, you can run the following code. In this case, we are using a trace_id value of 2 (used by the sys.fn_trace_geteventinfo function):
SELECT te.trace_event_id, name, package_name, xe_event_name
FROM sys.trace_events te
JOIN sys.trace_xe_event_map txe ON te.trace_event_id = txe.trace_event_id
WHERE te.trace_event_id IN (
SELECT DISTINCT(eventid) FROM sys.fn_trace_geteventinfo(2))
ORDER BY name
If we run the trace we created previously in the SQL Trace section, we will get the following output:

As you can see, the event names of our selected SQL Trace events are very similar to their extended events counterparts, except for SP:Completed, whose extended events name is module_end. Here are the definitions of these events:

Note
SQL Server comes with several extended events templates. One of them, called Query Detail Sampling, collects detailed statement and error information and includes the five listed events, plus error_reported. It also has some predefined actions and predicates, and it uses the ring_buffer target to collect its data. Its predefined predicated filters only collect 20 percent of the active sessions on the server at any given time, so perhaps that is something you may decide to change.
Working with extended events
At this point, we have enough information to create an extended events session. Extended events include different DDL commands to work with sessions, such as CREATE EVENT SESSION, ALTER EVENT SESSION, and DROP EVENT SESSION. But first, we will learn how to create a session using the extended events graphical user interface, which you can use to easily create and manage extended events sessions, as well as script the generated CREATE EVENT code. To start, in Management Studio, expand the Management and Extended Event nodes and right-click Sessions.
Note
By expanding the Sessions node, you will see three extended events sessions that are defined by default: AlwaysOn_health, telemetry_xevents, and system_health. system_health is started by default every time SQL Server starts, and it is used to collect several predefined events to troubleshoot performance issues. AlwaysOn_health, which is off by default, is a session designed to provide monitoring for Availability Groups, a feature introduced with SQL Server 2012. telemetry_xevents, introduced with SQL Server 2016, is also started by default and includes a large number of events that can also be used to troubleshoot problems with SQL Server. You can see the events, actions, predicates, targets, and configurations that have been defined for these sessions by looking at their properties or scripting them. To script an extended events session in Management Studio, right-click the session and select both Script Session As and CREATE To.
You should see the New Session wizard and the New Session dialog. In this section, we will be briefly introduced to the New Session dialog. Once you select it, you should see the following screen, along with four different pages: General, Events, Data Storage, and Advanced:
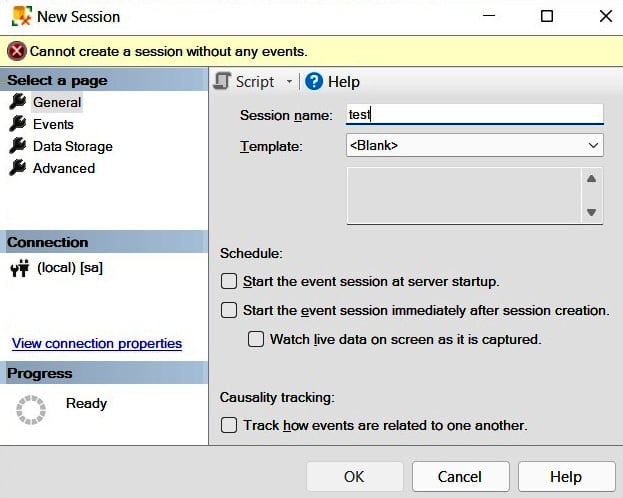
Figure 2.2 – The General page of the New Session dialog
Name the session Test and click the Events page in the selection area on the left.
The Events page allows you to select the events for your session. Because this page may contain a lot of information, you may want to maximize this window. Searching for events in the event library is allowed; for example, because four of the five events we are looking for contain the word completed, you could just type this word to search for them, as shown here:
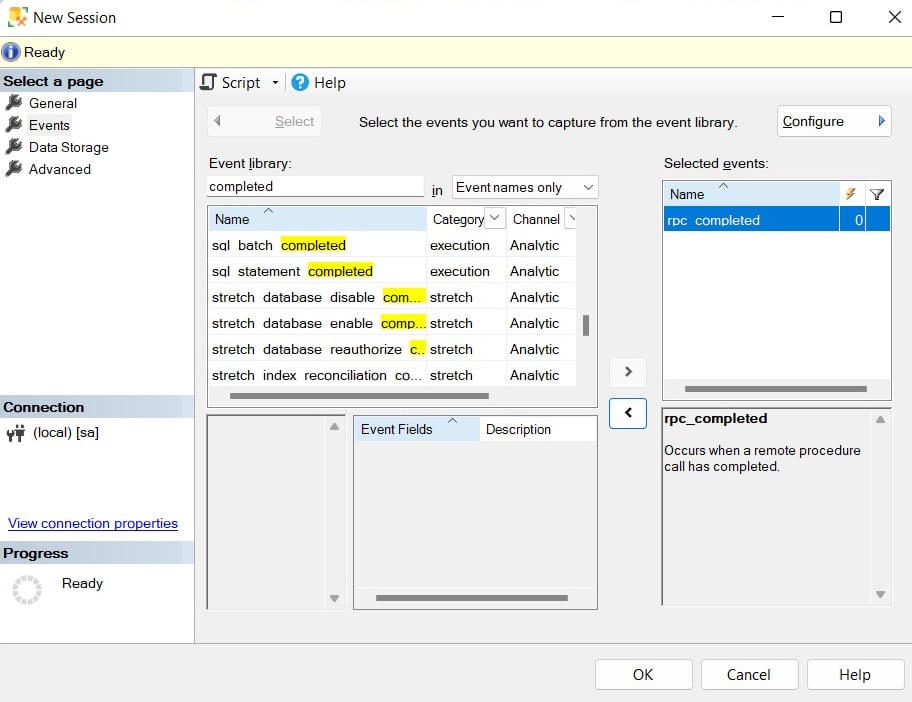
Figure 2.3 – The Events page of the New Session dialog
Click the > button to select the rpc_completed, sp_statement_completed, sql_batch_completed, and sql_statement_completed events. Do a similar search and add the module_end event. The Events page also allows you to define actions and predicates (filters) by clicking the Configure button, which shows the Event Configuration Options section. Click the Configure button, and in addition to selecting our five chosen extended events, check the boxes for the following actions in the Global Fields (Actions) tab: plan_handle, query_hash, query_plan_hash, and sql_text. Your current selection should look as follows:
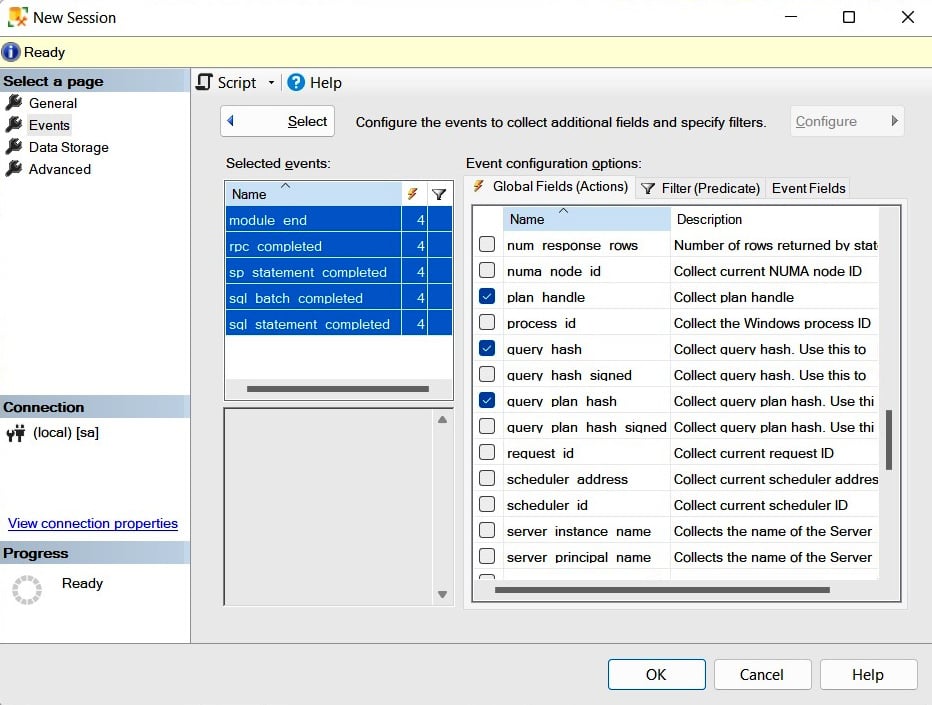
Figure 2.4 – The Event configuration options section of the Events page
Clicking the Data Storage page allows you to select one or more targets to collect your event data. Select the ring_buffer target, as shown in the following screenshot:
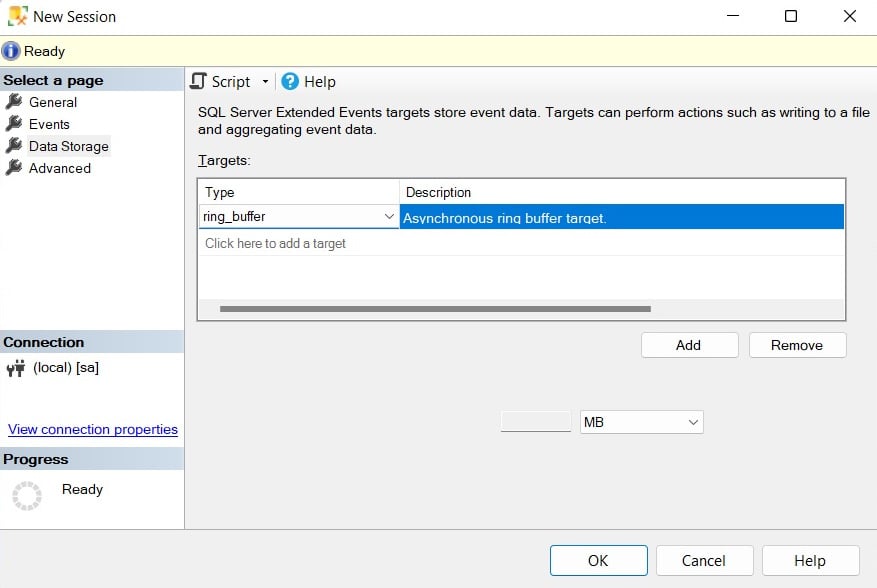
Figure 2.5 – The Data Storage page of the New Session dialog
The Advanced page allows you to specify additional options to use with the event session. Let’s keep all the default options as-is on this page.
Finally, as usual in Management Studio, you can also script all the selections you have made by clicking the Script icon at the top of the New Session window. Let’s do just that. This will create the following code, which we can use to create our extended events session:
CREATE EVENT SESSION test ON SERVER
ADD EVENT sqlserver.module_end(
ACTION(sqlserver.plan_handle,sqlserver.query_hash,sqlserver.query_plan_hash,
sqlserver.sql_text)),
ADD EVENT sqlserver.rpc_completed(
ACTION(sqlserver.plan_handle,sqlserver.query_hash,sqlserver.query_plan_hash,
sqlserver.sql_text)),
ADD EVENT sqlserver.sp_statement_completed(
ACTION(sqlserver.plan_handle,sqlserver.query_hash,sqlserver.query_plan_hash,
sqlserver.sql_text)),
ADD EVENT sqlserver.sql_batch_completed(
ACTION(sqlserver.plan_handle,sqlserver.query_hash,sqlserver.query_plan_hash,
sqlserver.sql_text)),
ADD EVENT sqlserver.sql_statement_completed(
ACTION(sqlserver.plan_handle,sqlserver.query_hash,sqlserver.query_plan_hash,
sqlserver.sql_text))
ADD TARGET package0.ring_buffer
WITH (STARTUP_STATE=OFF)
As shown in the previous chapter, we also need to start the extended events session by running the following code:
ALTER EVENT SESSION [test]
ON SERVER
STATE=START
So, at the moment, our session is active, and we just need to wait for the events to occur. To test it, run the following statements:
SELECT * FROM Sales.SalesOrderDetail WHERE SalesOrderID = 60677
GO
SELECT * FROM Person.Address WHERE AddressID = 21
GO
SELECT * FROM HumanResources.Employee WHERE BusinessEntityID = 229
GO
Once you have captured some events, you may want to read and analyze their data. You can use the Watch Live Data feature that was introduced with SQL Server 2012 to view and analyze the extended events data that was captured by the event session, as introduced in the previous chapter. Alternatively, you can use XQuery to read the data from any of the targets. To read the current captured events, run the following code:
SELECT name, target_name, execution_count, CAST(target_data AS xml)
AS target_data
FROM sys.dm_xe_sessions s
JOIN sys.dm_xe_session_targets t
ON s.address = t.event_session_address
WHERE s.name = 'test'
This will produce an output similar to the following:

You can open the link to see the captured data in XML format. Because the XML file would be too large to show in this book, only a small sample of the first event that was captured, showing cpu_time, duration, physical_reads, and logical_reads, and writes, is included here:
<RingBufferTarget truncated="0" processingTime="0" totalEventsProcessed="12"
eventCount="12" droppedCount="0" memoryUsed="5810">
<event name="sql_batch_completed" package="sqlserver"
timestamp="2022-06-01T20:08:42.240Z">
<data name="cpu_time">
<type name="uint64" package="package0" />
<value>0</value>
</data>
<data name="duration">
<type name="uint64" package="package0" />
<value>1731</value>
</data>
<data name="physical_reads">
<type name="uint64" package="package0" />
<value>0</value>
</data>
<data name="logical_reads">
<type name="uint64" package="package0" />
<value>4</value>
</data>
<data name="writes">
<type name="uint64" package="package0" />
<value>0</value>
</data>
However, because reading XML directly is not much fun, we can use XQuery to extract the data from the XML document and get a query like this:
SELECT
event_data.value('(event/@name)[1]', 'varchar(50)') AS event_name,
event_data.value('(event/action[@name="query_hash"]/value)[1]',
'varchar(max)') AS query_hash,
event_data.value('(event/data[@name="cpu_time"]/value)[1]', 'int')
AS cpu_time,
event_data.value('(event/data[@name="duration"]/value)[1]', 'int')
AS duration,
event_data.value('(event/data[@name="logical_reads"]/value)[1]', 'int')
AS logical_reads,
event_data.value('(event/data[@name="physical_reads"]/value)[1]', 'int')
AS physical_reads,
event_data.value('(event/data[@name="writes"]/value)[1]', 'int') AS writes,
event_data.value('(event/data[@name="statement"]/value)[1]', 'varchar(max)')
AS statement
FROM(SELECT evnt.query('.') AS event_data
FROM
(SELECT CAST(target_data AS xml) AS target_data
FROM sys.dm_xe_sessions s
JOIN sys.dm_xe_session_targets t
ON s.address = t.event_session_address
WHERE s.name = 'test'
AND t.target_name = 'ring_buffer'
) AS data
CROSS APPLY target_data.nodes('RingBufferTarget/event') AS xevent(evnt)
) AS xevent(event_data)
This will show an output similar to the following:
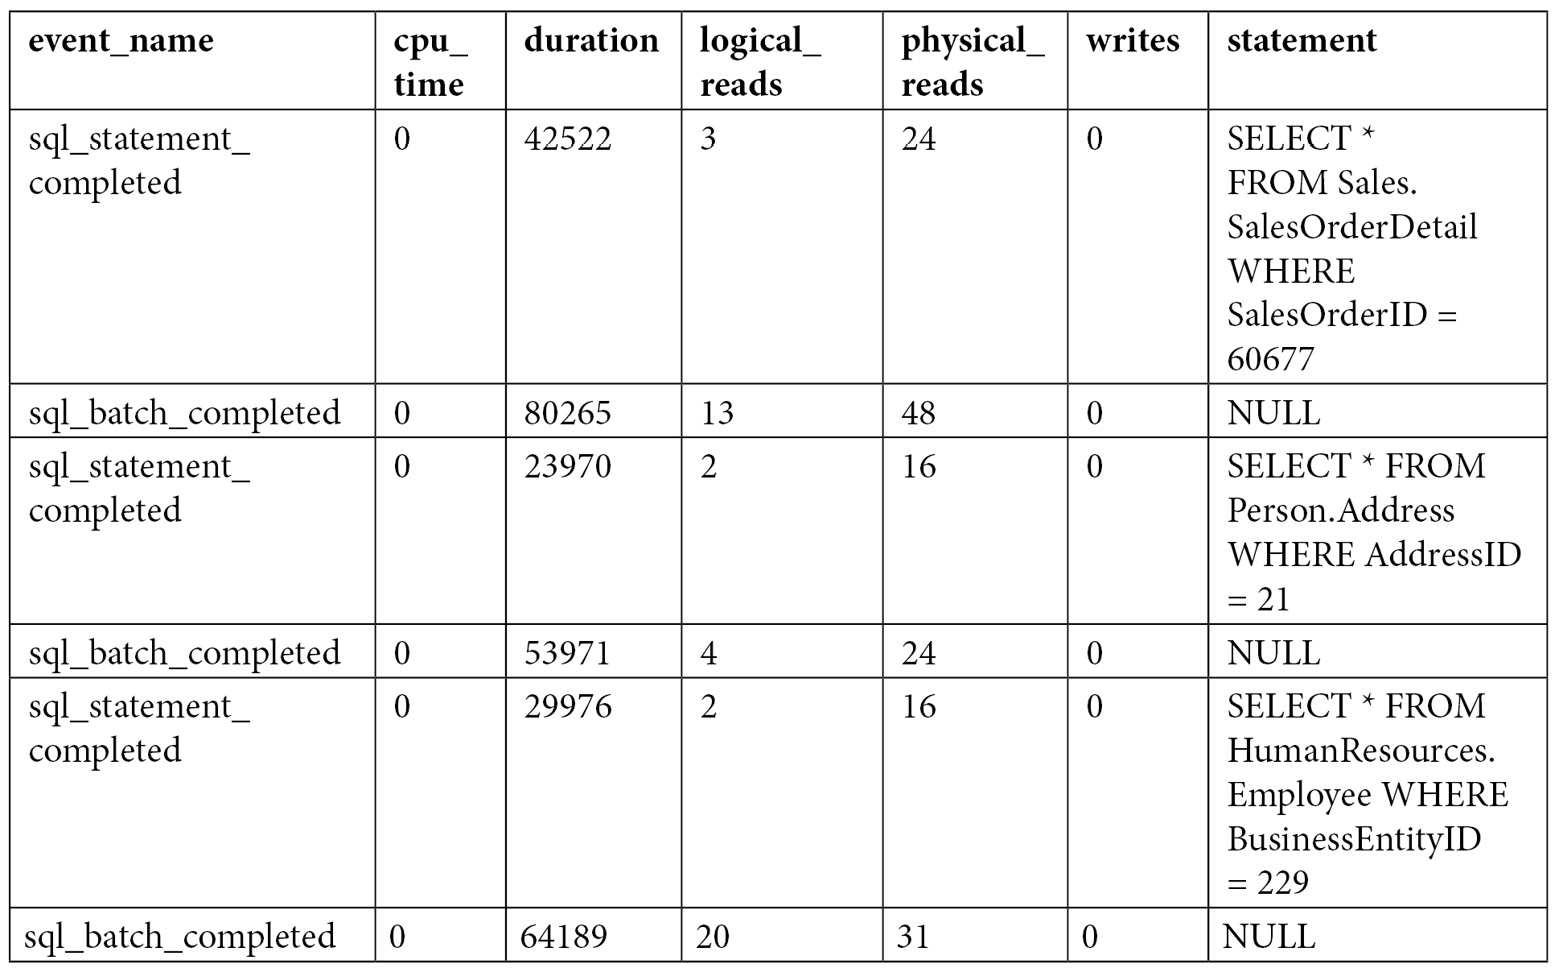
However, using that query, you get all the data for each event, and sometimes, you may want to aggregate the data. For example, sorting the data to look for the greatest CPU consumers may not be enough. As you will also see in other areas of this book, sometimes, a performance problem may be caused by some query that, even if it does not show up on the top 10 consumers, or even the top 100, is executed so many times that its aggregated CPU usage can make it one of the top CPU consumers. You can update the previous query to aggregate this data directly, or you can change it to save the information to a temporary table (for example, using SELECT … INTO) and then group by query_hash and, optionally, sort as needed, as shown here:
SELECT query_hash, SUM(cpu_time) AS cpu_time, SUM(duration) AS duration,
SUM(logical_reads) AS logical_reads, SUM(physical_reads) AS physical_reads,
SUM(writes) AS writes, MAX(statement) AS statement
FROM #eventdata
GROUP BY query_hash
Again, as covered in the previous chapter, after you finish your test, you need to stop and delete the event session. Run the following statements:
ALTER EVENT SESSION [test]
ON SERVER
STATE=STOP
GO
DROP EVENT SESSION [test] ON SERVER
You could also use the file target when collecting large amounts of data or running the session for a long time. The following example is exactly the same as before, but using the file target (note the file definition on the C:\Data folder):
CREATE EVENT SESSION test ON SERVER
ADD EVENT sqlserver.module_end(
ACTION(sqlserver.plan_handle,sqlserver.query_hash,sqlserver.query_plan_hash,
sqlserver.sql_text)),
ADD EVENT sqlserver.rpc_completed(
ACTION(sqlserver.plan_handle,sqlserver.query_hash,sqlserver.query_plan_hash,
sqlserver.sql_text)),
ADD EVENT sqlserver.sp_statement_completed(
ACTION(sqlserver.plan_handle,sqlserver.query_hash,sqlserver.query_plan_hash,
sqlserver.sql_text)),
ADD EVENT sqlserver.sql_batch_completed(
ACTION(sqlserver.plan_handle,sqlserver.query_hash,sqlserver.query_plan_hash,
sqlserver.sql_text)),
ADD EVENT sqlserver.sql_statement_completed(
ACTION(sqlserver.plan_handle,sqlserver.query_hash,sqlserver.query_plan_hash,
sqlserver.sql_text))
ADD TARGET package0.event_file(SET filename=N'C:\Data\test.xel')
WITH (STARTUP_STATE=OFF)
After starting the session and capturing some events, you can query its data by using the following query and the sys.fn_xe_file_target_read_file function:
SELECT
event_data.value('(event/@name)[1]', 'varchar(50)') AS event_name,
event_data.value('(event/action[@name="query_hash"]/value)[1]',
'varchar(max)') AS query_hash,
event_data.value('(event/data[@name="cpu_time"]/value)[1]', 'int')
AS cpu_time,
event_data.value('(event/data[@name="duration"]/value)[1]', 'int')
AS duration,
event_data.value('(event/data[@name="logical_reads"]/value)[1]', 'int')
AS logical_reads,
event_data.value('(event/data[@name="physical_reads"]/value)[1]', 'int')
AS physical_reads,
event_data.value('(event/data[@name="writes"]/value)[1]', 'int') AS writes,
event_data.value('(event/data[@name="statement"]/value)[1]', 'varchar(max)')
AS statement
FROM
(
SELECT CAST(event_data AS xml)
FROM sys.fn_xe_file_target_read_file
(
'C:\Data\test*.xel',
NULL,
NULL,
NULL
)
) AS xevent(event_data)
If you inspect the C:\Data folder, you will find a file with a name similar to test_0_130133932321310000.xel. SQL Server adds "_0_" plus an integer representing the number of milliseconds since January 1, 1600, to the specified filename. You can inspect the contents of a particular file by providing the assigned filename or by using a wildcard (such as the asterisk shown in the preceding code) to inspect all the available files. For more details on using the file target, see the SQL Server documentation. Again, don’t forget to stop and drop your session when you finish testing.
Finally, we will use extended events to show you how to obtain the waits for a specific query, something that was not even possible before extended events. You must use the wait_info event and select any of the many available fields (such as username or query_hash) or selected actions to apply a filter (or predicate) to it. In this example, we will use session_id. Make sure to replace session_id as required if you are testing this code:
CREATE EVENT SESSION [test] ON SERVER
ADD EVENT sqlos.wait_info(
WHERE ([sqlserver].[session_id]=(61)))
ADD TARGET package0.ring_buffer
WITH (STARTUP_STATE=OFF)
Start the event:
ALTER EVENT SESSION [test]
ON SERVER
STATE=START
Run some transactions but note that they need to be executed in the session ID you specified (and they need to create waits). For example, run the following query:
SELECT * FROM Production.Product p1 CROSS JOIN
Production.Product p2
Then, you can read the captured data:
SELECT
event_data.value('(event/@name)[1]', 'varchar(50)') AS event_name,
event_data.value('(event/data[@name="wait_type"]/text)[1]', 'varchar(40)')
AS wait_type,
event_data.value('(event/data[@name="duration"]/value)[1]', 'int')
AS duration,
event_data.value('(event/data[@name="opcode"]/text)[1]', 'varchar(40)')
AS opcode,
event_data.value('(event/data[@name="signal_duration"]/value)[1]', 'int')
AS signal_duration
FROM(SELECT evnt.query('.') AS event_data
FROM
(SELECT CAST(target_data AS xml) AS target_data
FROM sys.dm_xe_sessions s
JOIN sys.dm_xe_session_targets t
ON s.address = t.event_session_address
WHERE s.name = 'test'
AND t.target_name = 'ring_buffer'
) AS data
CROSS APPLY target_data.nodes('RingBufferTarget/event') AS xevent(evnt)
) AS xevent(event_data)
Here is the output on my system:
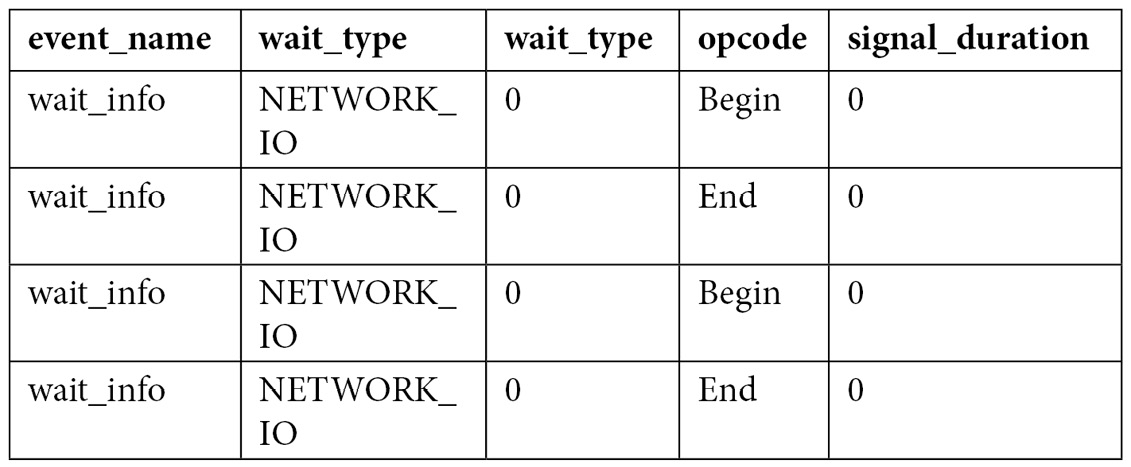
Again, this is another example where aggregating the captured data would be beneficial. Finally, don’t forget to stop and drop your event session, as indicated previously.
So, now that we have covered several features that we can use to collect query performance information, such as DMVs, DMFs, SQL Trace, and extended events, let’s close this chapter with the Data Collector. The Data Collector is a tool that’s designed to collect performance data and is especially useful in cases where you do not have access to a dedicated third-party tool.


