
The following graph shows the quarterly GDP growth of one of Europe's leading economies. The series has been compiled at a quarterly level, and all data points from 2005 to Q3 in 2017 have been used to plot the graph. We can see that there was a decline in GDP between Q3 in 2006 and Q1 in 2009, but GDP has primarily seen an upward trajectory since then, as follows:
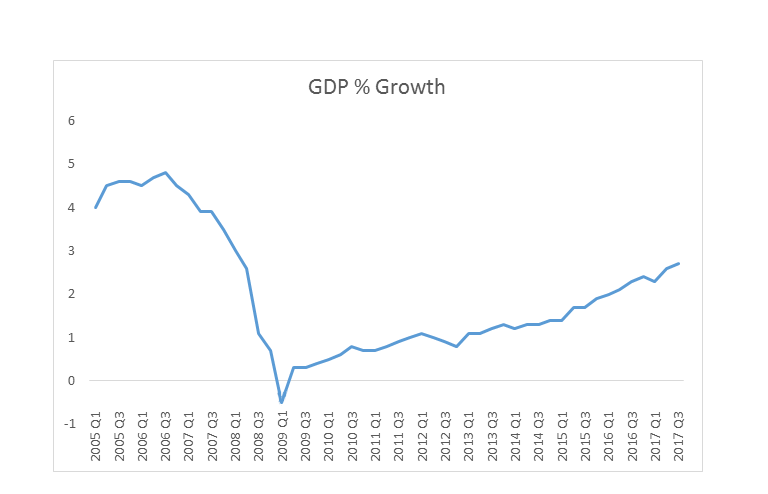
Figure 1.1: GDP quarterly growth of a leading European economy