


Generating 3D graphics
One of the built-in functions to generate 3D graphics is persp. The persp function draws perspective plots of a surface over the x-y plane. The persp function has many optional parameters and will likely produce the graphics that you need. As a test, you can use the following example function, and it will generate three 3D graphics:
> example(persp)
This function call will generate three graphics.
(Included in the output are all of the commands necessary to generate the graphics.)
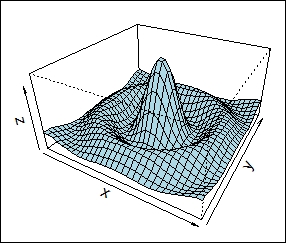
The first generated image shows a 3D plot of a rotated sine function. The associated R commands (also generated for you) are as follows:
> persp(x, y, z, theta = 30, phi = 30, expand = 0.5, col = "lightblue")
Here's the first generated image:
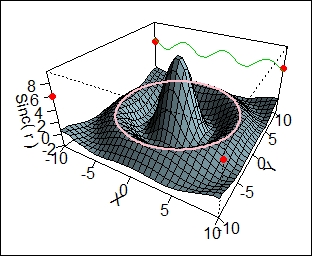
The next image is a more detailed view of the same data:
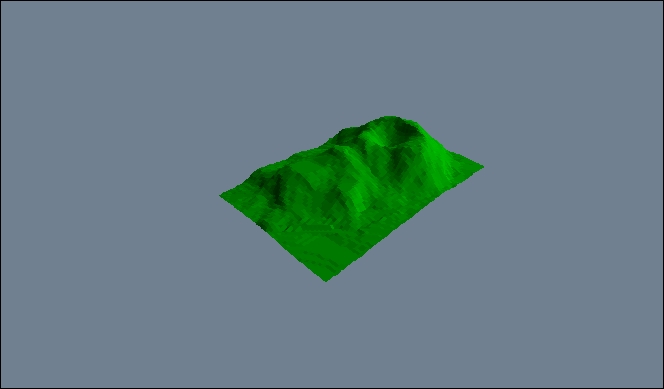
Lastly, we have a simulated 3D surface area presentation:
The persp function looks like this:
persp(x = seq(0, 1, length.out = nrow(z)),
      y = seq(0, 1, length.out = ncol(z)),
      z, xlim = range...


