Kivy inspector – debugging interfaces
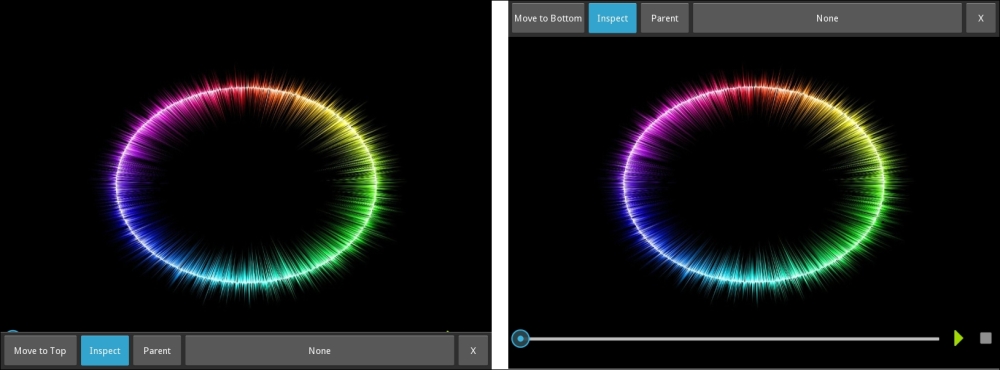
Sometimes, we encounter problems when we implement our interfaces, and it can be difficult to understand what went wrong, especially when many of the widgets don't have a graphic display. In this section, we will use the application that we created in this chapter to introduce the Kivy inspector, a simple tool to debug interfaces. In order to start the inspector, you run the following command: python kivyplayer.py –m inspector. You won't notice any difference at the beginning but if you press Ctrl + E, a bar will appear at the bottom of the screen, just like the one in the left screenshot of the following image:

If we press the button Move to Top (the first from left to right in the bar), the bar will move to the top of the screen as you can see in the right screenshot, a more convenient position for our particular application. The second button Inspect activates or deactivates the inspector behavior. We can now highlight components by clicking on them...


