Building Unity games with Visual Studio
Before you start writing any code, it is important to choose suitable development tools. Microsoft's Visual Studio is not only a widely used IDE but also the development environment that is installed by default when you install Unity on Windows or macOS:
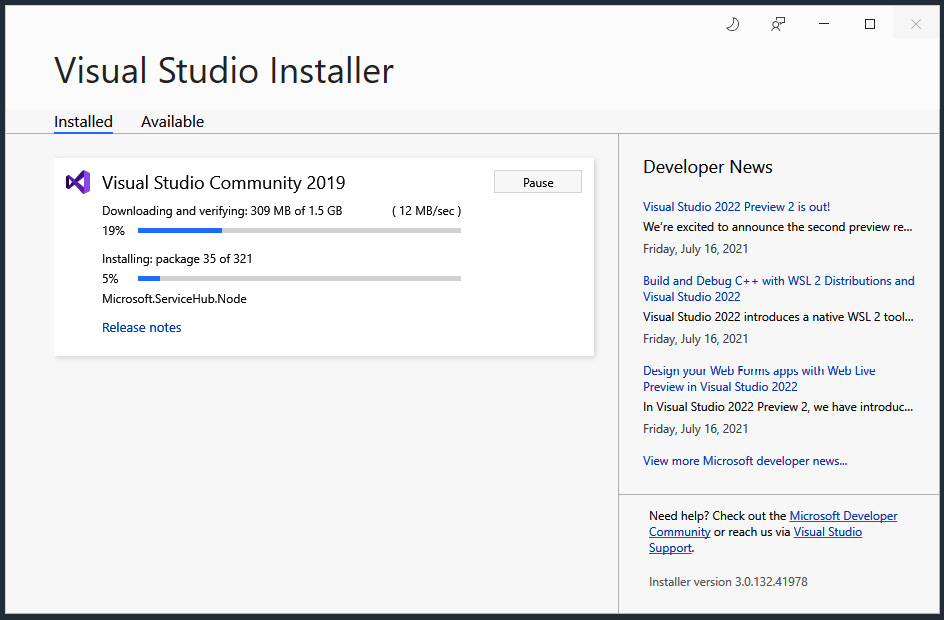
Figure 1.52 – Visual Studio Installer
While installing Visual Studio, Visual Studio Tools for Unity will also be installed. It is a free extension that provides support for writing and debugging C# in Unity.
If you do not install Visual Studio through the Unity Hub, please make sure you installed this extension. You can check it in the Visual Studio Installer:
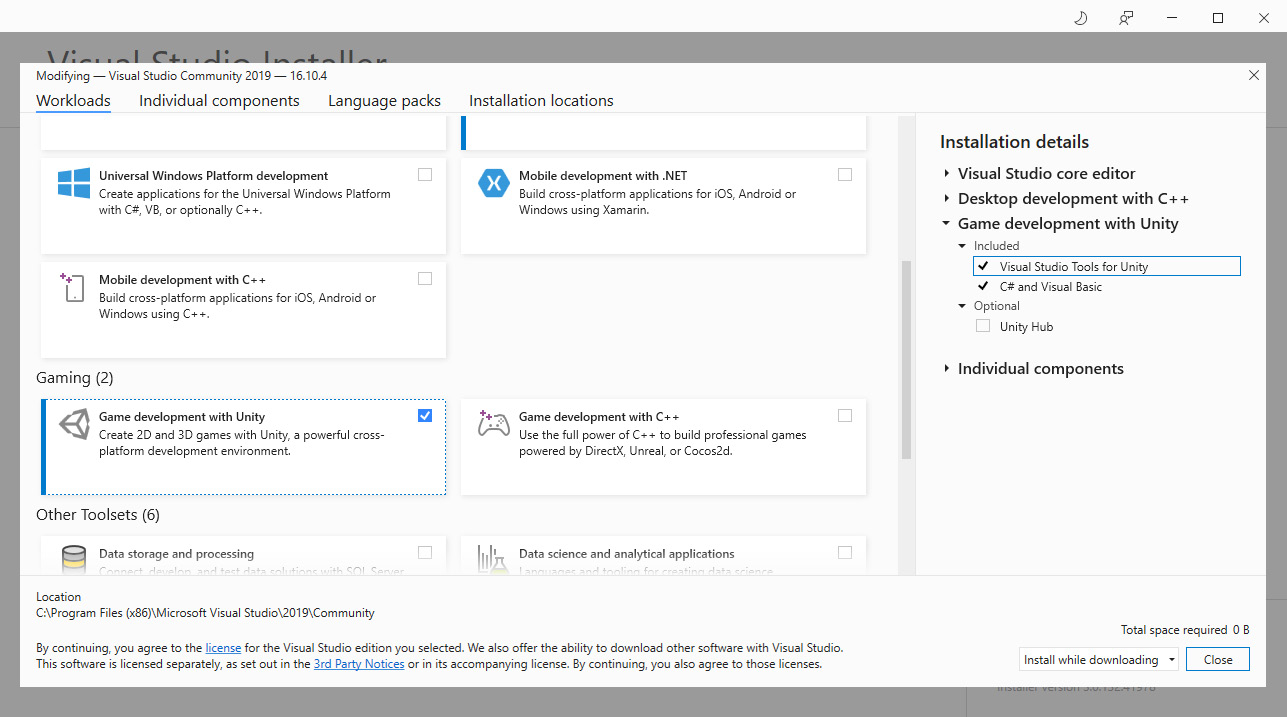
Figure 1.53 – Installing Visual Studio Tools for Unity
After installing the Unity Editor and Visual Studio Community 2019, you can check the External Script Editor settings in the Preferences window of the Unity Editor:
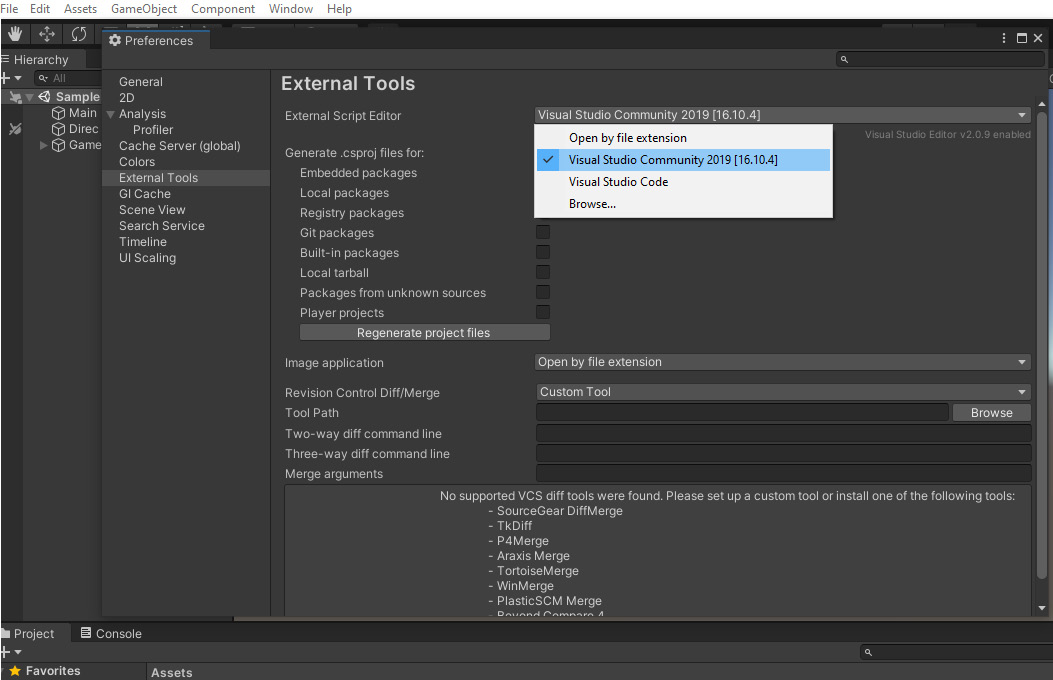
Figure 1.54 – The External Script Editor settings
In addition, you can also select other script editors by modifying this setting, such as Visual Studio Code and JetBrains Rider.
Then, we can create a new C# script file named NewBehaviourScript in the Unity Editor and double-click to open it in Visual Studio:
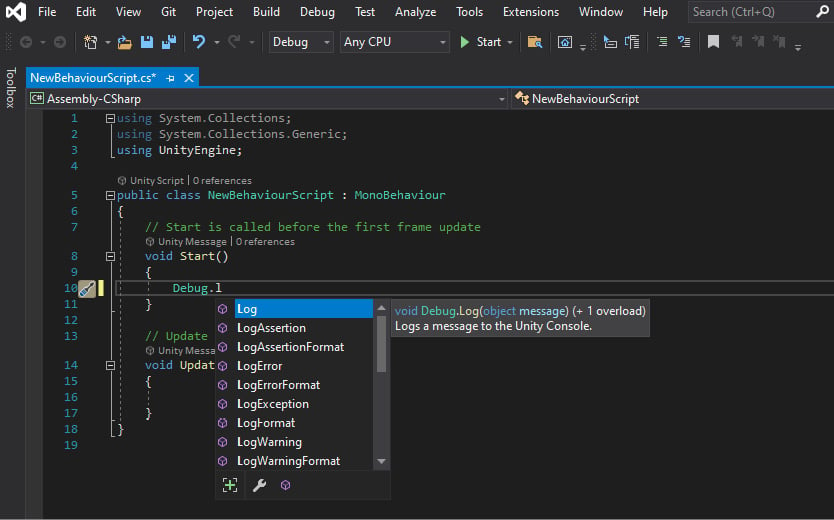
Figure 1.55 – IntelliSense for the Unity APIs
As you can see in the preceding screenshot, there are two built-in methods in the script file by default, namely Start and Update. Visual Studio supports IntelliSense for Unity APIs, so we can write code quickly:
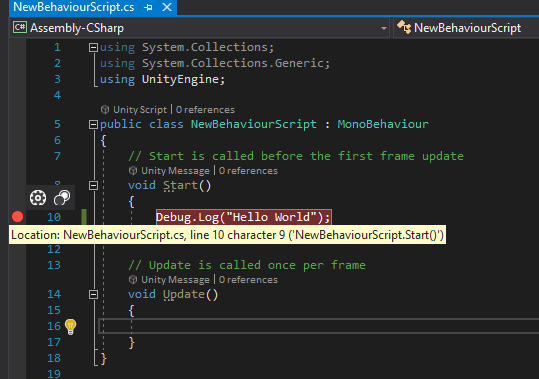
Figure 1.56 – Debugging your code
It is also very easy to debug your code in Visual Studio. In the preceding screenshot, I set a breakpoint inside the Start method and clicked the Attach to Unity button in Visual Studio:
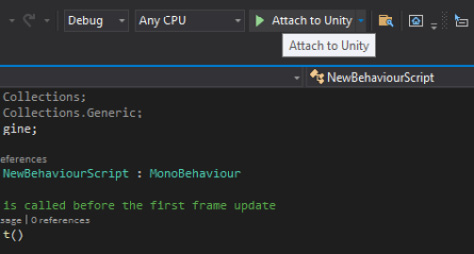
Figure 1.57 – Clicking the Attach to Unity button
In order to run this code, I attach this script to a GameObject in the Scene and click on the Play button in the Unity Editor to run the game in the Game view.
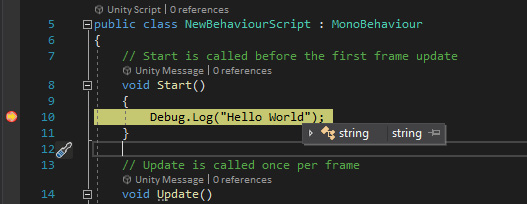
Figure 1.58 – The debugger stopping at the breakpoint
Then, the debugger will stop at the breakpoint, and you can look at the current state of the game.