Monitoring YARN
The RM provides a friendly web interface to view the cluster and its resources. The home page of this interface gives details about the cluster, such as the RM state, number of applications, the total memory available, total number of nodes, and node status, among other details. The next screenshot shows the home page.
On the left-hand side of the screen, there are links to navigate and get different kinds of details of the cluster.

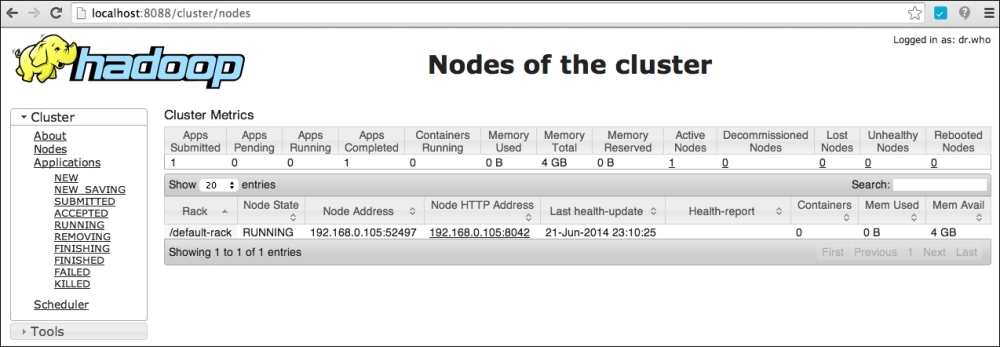
Clicking on the Nodes link on the left-hand pane gives the details of the nodes in the YARN cluster. The following screenshot shows an example of a single node cluster. For each node in the cluster, the screen gives details on the rack it belongs to, the node state, resource consumption (memory for now) on the node, HTTP address of the node, and last heartbeat details of the node, among other details.
The last-health update column in the nodes grid tells when the RM received the last heartbeat from the NM.

The Applications link on the left-hand pane...


