Search icon CANCEL
Arrow left icon
Explore Products
Best Sellers
New Releases
Books
Videos
Audiobooks
Learning Hub
Conferences
Free Learning
Arrow right icon
Arrow up icon
GO TO TOP
Hands-On Visual Studio 2022

You're reading from   Hands-On Visual Studio 2022 A developer's guide to new features and best practices with .NET 8 and VS 2022 for maximum productivity

Arrow left icon
Product type Paperback
Published in Mar 2024
Publisher Packt
ISBN-13 9781835080443
Length 336 pages
Edition 2nd Edition
Languages
Tools
Arrow right icon
Authors (2):
Arrow left icon
Miguel Angel Teheran Garcia Miguel Angel Teheran Garcia
Author Profile Icon Miguel Angel Teheran Garcia
Miguel Angel Teheran Garcia
Hector Uriel Perez Rojas Hector Uriel Perez Rojas
Author Profile Icon Hector Uriel Perez Rojas
Hector Uriel Perez Rojas
Arrow right icon
View More author details
Toc

Table of Contents (19) Chapters Close

Preface 1. Part 1: Visual Studio Overview FREE CHAPTER
2. Chapter 1: Getting Started with Visual Studio 2022 3. Chapter 2: Creating Projects and Templates 4. Chapter 3: Debugging and Profiling Your Apps 5. Part 2: Tools and Productivity
6. Chapter 4: Adding Code Snippets 7. Chapter 5: Coding Efficiently with AI and Code Views 8. Chapter 6: Using Tools for Frontend and Backend Development 9. Chapter 7: Styling and Cleanup Tools 10. Chapter 8: Publishing Projects 11. Part 3: GitHub Integration and Extensions
12. Chapter 9: Implementing Git Integration 13. Chapter 10: Sharing Code with Live Share 14. Chapter 11: Working with Extensions in Visual Studio 15. Chapter 12: Using Popular Extensions 16. Chapter 13: Learning Keyboard Shortcuts 17. Index 18. Other Books You May Enjoy

Debugging in JavaScript

We must debug a project when there is strange behavior, an issue, or a blocker in our application. VS supports debugging for many programming languages, including JavaScript. This is a great feature, given that we can debug the frontend side (for example, with JavaScript) and the backend side (for example, with C#) using the same IDE.

To debug JavaScript and TypeScript code using VS, we need to check the Script Debugging (Enabled) option. This option is on the execution menu of the project:
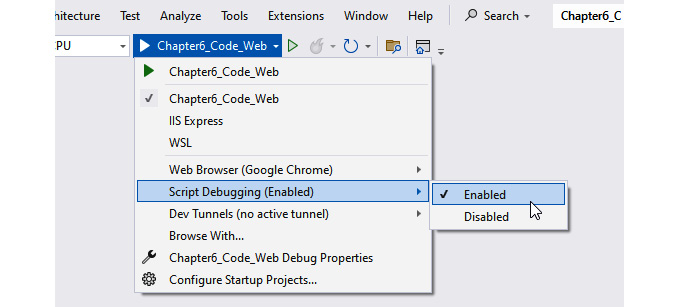
Figure 6.12 – The Script Debugging (Enabled) option in the project execution menu

Figure 6.12 – The Script Debugging (Enabled) option in the project execution menu

Then, we can run the project in debug mode, but before that, we need to add a break to inspect the code. Navigate to ClientApp | src | components | Counter.js and create a new breakpoint at line 13 (see Figure 6.13):
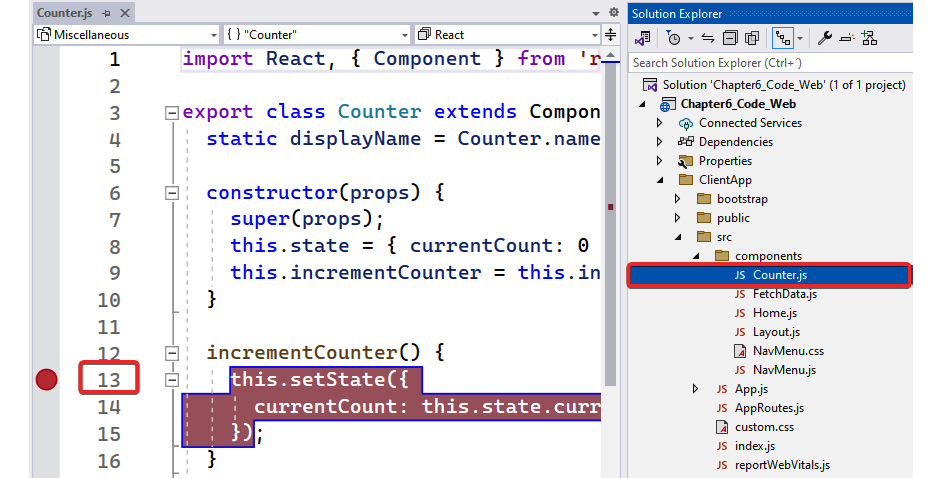
Figure 6.13 – A breakpoint in the incrementCounter method inside Counter.js

Figure 6.13 – A breakpoint in the incrementCounter method inside Counter.js

Now, execute the project...

lock icon The rest of the chapter is locked
Register for a free Packt account to unlock a world of extra content!
A free Packt account unlocks extra newsletters, articles, discounted offers, and much more. Start advancing your knowledge today.
Unlock this book and the full library FREE for 7 days
Get unlimited access to 7000+ expert-authored eBooks and videos courses covering every tech area you can think of
Renews at €18.99/month. Cancel anytime