Understanding the Delphi IDE
The idea of combining the editing, compiling, and managing of project files within one integrated programming application started way back in the 1970s, but didn't really catch on in the PC arena for quite some time. Borland Pascal, the pre-cursor to Delphi, pioneered many facets of an IDE in the creation of Disk Operating System (DOS) applications and took many of its features and user interface constructs with it to the Windows desktop.
At its core, an IDE needs to assist the developer in managing a software project's many moving parts: editing source code, crafting user interfaces, managing project parameters, compiling the application and resources, testing and debugging, and preparing a deployable application. These vary from language to language, so an IDE needs to understand the tools that it supports very well—and the developers who use it.
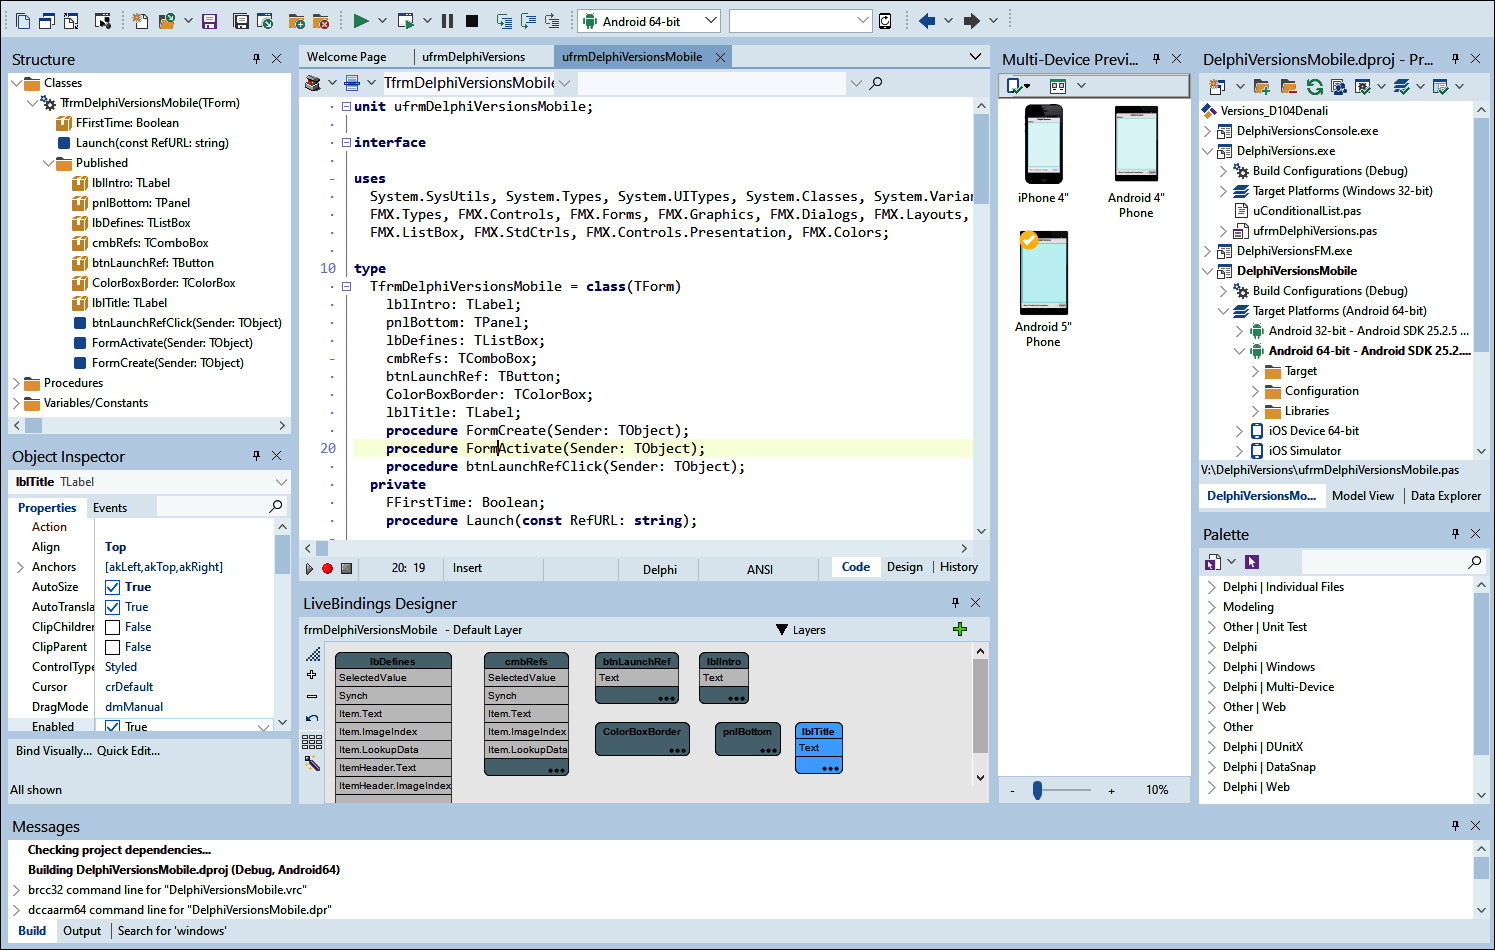
Delphi's IDE, like many other modern tools, has a rich code editor with syntax checking and color schemes, resizable window panes, structure and object views, data and source repository connections, and the ability to save various configurations for different needs. Here are the various windows and views you'll find in Delphi:
- Code Editor: The main focal point for writing code.
- Project Manager: Combine files necessary for compiling a project.
- Object Inspector: Access properties and events of components.
- Structure Pane: View and organize components hierarchically.
- Tool Palette: Component list.
- Message Window: Compilation output, search results, and more.
- To-Do List: Parsed TODO comments from the code are neatly displayed here.
- Templates: Macros for expanding frequently typed patterns of code.
- LiveBindings Designer: Visually build data connections between components.
- Class Explorer: Tree view of the classes in the current unit.
- Data Explorer: View data and manage connections from dbExpress or FireDAC sources without leaving the IDE.
- Model View: Manage object models of your data.
- Other Debugger views: Call Stack, watches, local variables, breakpoints, Threads, events, Modules, and CPU windows.
The following screenshot shows these windows and views in the Delphi IDE:

Figure 1.1 – The Delphi 10.4 Sydney IDE showing several available window panes
Let's look at some of these in a little more detail.
Like most popular code editors that developers use these days, there is color syntax highlighting, hotkeys for moving code around, bookmarks, class completion, and template expansion. There is a lot of keyboard backward-compatibility in Delphi (even dating back to the old WordStar days) but also a lot of customization to set up the key combinations that work best for you. Classes and methods can be folded (or "collapsed"), and you can create your own foldable regions. Error insight can alert you to syntactical errors in your code as you type.
The Project Manager can contain a single project or a group of projects, and there are buttons to manage aspects of them with ease—as a group or individually. You can determine where compiled objects will be placed, establish host applications to debug modules, and manage multiple platform configurations here. More on this will be covered in Chapter 2, Delphi Project Management.
The Object Inspector allows you to initialize properties and hook up events of components at design time to save you the trouble of having to write all that out in code. If you build custom components, you can publish your own properties and events, which will also show up here. Plus, you can register your own property editors to provide even greater functionality.
The Structure pane is a handy view of elements that changes depending on the context. When you're in the code editor, it shows the list of classes, methods, and used units in the current unit. When you're in the form designer, it shows a tree view of the components on the form that can be rearranged by dragging them with the mouse to a different place on the hierarchy (with some obvious parent-container restrictions; for example, a panel can contain a label, whereas a label cannot contain a panel). Double-clicking one of these elements takes you to that element.
When you're designing a form or data module, you can place items on it from the Tool Palette. This is also context-sensitive, thereby only listing the elements that can be placed on the current form. For example, only FireMonkey components will be available for a FireMonkey form; but database connection components can be placed on a VCL form, a FireMonkey form, or a data module.
When building a project or running other processes, the output will be shown in the Message window. This is often collapsed but expands temporarily at appropriate times. Like most other windows, this pane can be pinned to keep it open and resized as desired. Search results and console application output will show up as tabs here.
The Delphi code editor watches for specific comments that start with TODO: and builds a list from these found in all the units of your project and shows them in a To-Do List window with a clickable checkbox. This allows you to see all the places in your code where you've marked items you need to finish. By double-clicking on the to-do list item, it will take you to that line in the code. When you are finished with the task, click the checkbox in the to-do list and it will mark it as complete by changing the comment from TODO to DONE. (You can also uncheck an item marked DONE and it will turn the comment back to TODO.)
Live templates (shown in the window pane that is simply titled Templates) can speed up coding considerably. They are code macros that can insert text and allow you to fill in the blanks to complete larger constructs with very few keystrokes. They can be set to automatically expand after a certain sequence of letters are typed or manually activated by hitting Ctrl + J. You can create your own or edit the built-in ones.
Some of the first code templates in Delphi were implemented by the popular free IDE plugin, GExperts (sort of a mix of Code Librarian and Code Proofreader) but other products soon introduced their own version. Live templates were added in Delphi 2006.
We'll talk about the LiveBindings Designer in greater detail in Chapter 6, All About LiveBindings, but as a brief overview, this is a visual way to link data between various entities. For example, a form that displays an edit box to type in a name has to load the value from somewhere and also save it when the user is done. Typing code to load and save such elements can become quite tedious. This lets you do it visually.
The Class Explorer (not shown in the previous screenshot) is similar to the Structure pane when viewing code in that they both show a tree view of classes. But while the Structure pane shows more than just classes, it has few options for actually dealing with the classes. That's where the Class Explorer shines—it allows you to view and manage methods, fields, and properties of classes with the mouse. Think of it as a simplified version of ModelMaker Code Explorer if you've ever used that product.
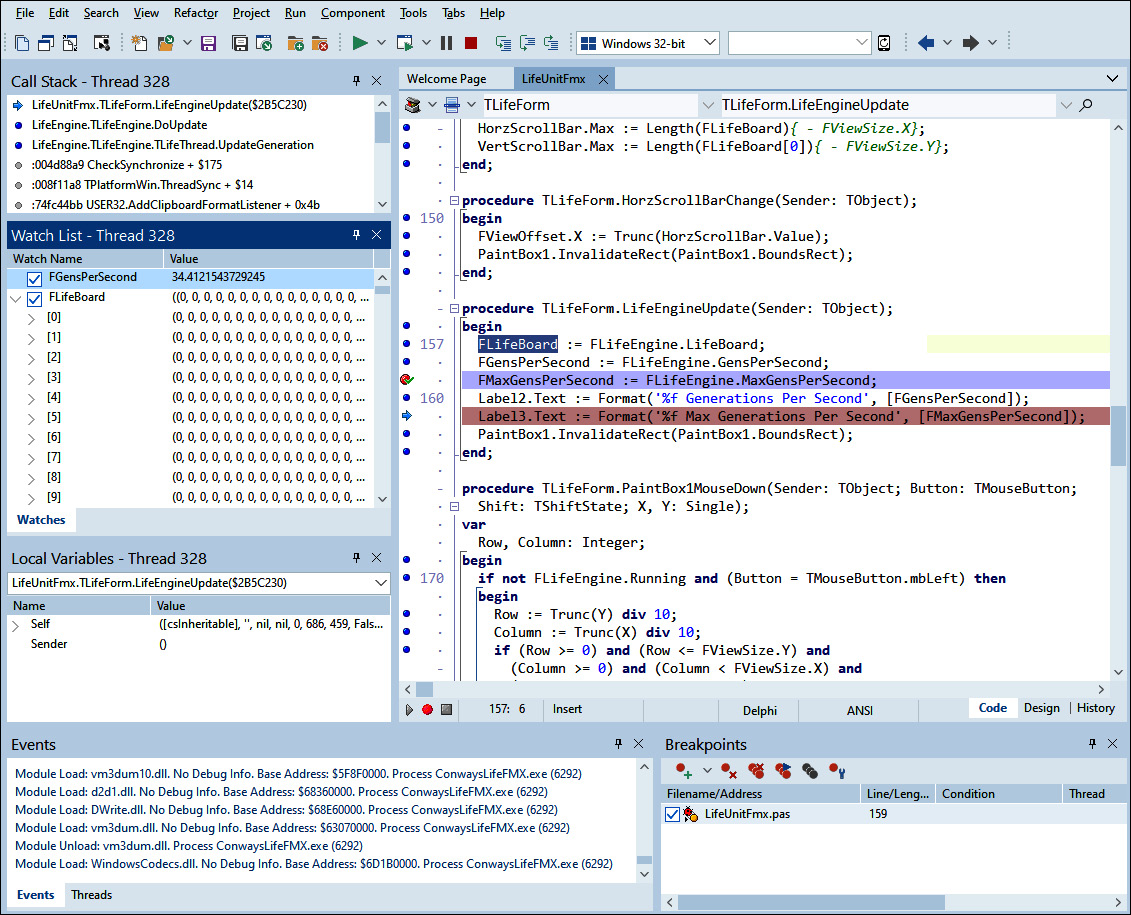
The IDE allows you to save the arrangement of these panes as desktop profiles. You can have several desktop profiles and use different ones for different projects. You can select one to be the default for standard editing and another as the default for debugging—the IDE will automatically switch to the debug desktop when you start an application and switch back to the default one when it's finished.
Here's an example of what the IDE could look like while debugging:

Figure 1.2 – Debugging an application in Delphi 10.4
As you can see, the Delphi IDE is center-stage in the development process of creating and managing Delphi projects. Since no two developers work the same way, its flexibility, customization, and the wide variety of built-in tools help make this environment a powerful tool.
Now that you've had a glimpse of what the IDE is, let's step back a few versions, highlighting some of the changes it has undergone.


