While reports allow you to gather and filter information, dashboards allow you to visualize various reports together through dashboard components. A dashboard is always built as an overlay to reports. We built an example report in the previous section, so now, let's add this report to a dashboard component:
- Click on the Dashboards tab (1) to start the process, as shown in the following screenshot:
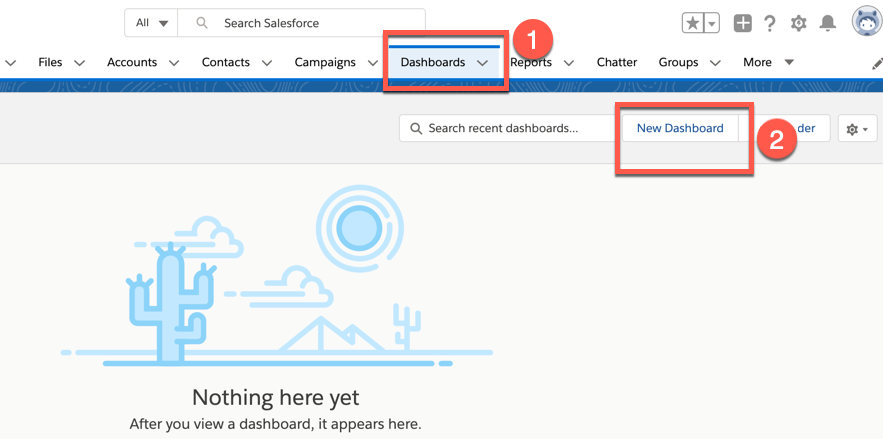
- Then, click on New Dashboard (2). You can name it anything you like; I have named my dashboard Account and Contact Dashboard (1).
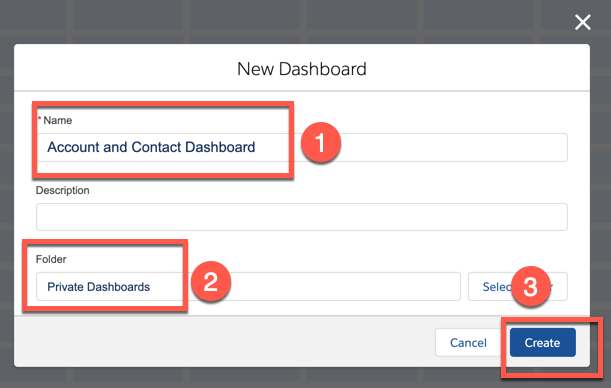
- This dashboard will be added to my Private Dashboards folder (2), which means it will only be visible to me. Once I've finished building it, I can choose to move it to a public folder that can be widely shared. Click on Create (3).
- After creating a private dashboard, we'll land on the dashboard builder...