Search icon CANCEL
Subscription
0
Cart icon
Your Cart (0 item)
Close icon
You have no products in your basket yet
Save more on your purchases now! discount-offer-chevron-icon
Savings automatically calculated. No voucher code required.
Arrow left icon
Explore Products
Best Sellers
New Releases
Books
Videos
Audiobooks
Learning Hub
Conferences
Free Learning
Arrow right icon
Arrow up icon
GO TO TOP
Network Analysis using Wireshark Cookbook

You're reading from   Network Analysis using Wireshark Cookbook This book will be a massive ally in troubleshooting your network using Wireshark, the world's most popular analyzer. Over 100 practical recipes provide a focus on real-life situations, helping you resolve your own individual issues.

Arrow left icon
Product type Paperback
Published in Dec 2013
Publisher Packt
ISBN-13 9781849517645
Length 452 pages
Edition 1st Edition
Arrow right icon
Author (1):
Arrow left icon
Yoram Orzach Yoram Orzach
Author Profile Icon Yoram Orzach
Yoram Orzach
Arrow right icon
View More author details
Toc

Table of Contents (17) Chapters Close

Preface 1. Introducing Wireshark FREE CHAPTER 2. Using Capture Filters 3. Using Display Filters 4. Using Basic Statistics Tools 5. Using Advanced Statistics Tools 6. Using the Expert Infos Window 7. Ethernet, LAN Switching, and Wireless LAN 8. ARP and IP Analysis 9. UDP/TCP Analysis 10. HTTP and DNS 11. Analyzing Enterprise Applications' Behavior 12. SIP, Multimedia, and IP Telephony 13. Troubleshooting Bandwidth and Delay Problems 14. Understanding Network Security A. Links, Tools, and Reading Index

Configuring IO Graphs with filters for measuring network performance issues


In this recipe we will learn how to use the IO Graph tool and how to configure it for network troubleshooting.

Getting ready

Under the Statistics menu, open the IO Graph tool by clicking on IO Graph. You can do this during an online file capture or on a file you've captured before. While using the IO Graph tool on a live capture, you will get live statistics on the captured data.

How to do it...

Run the IO Graph tool and you will get the following window:
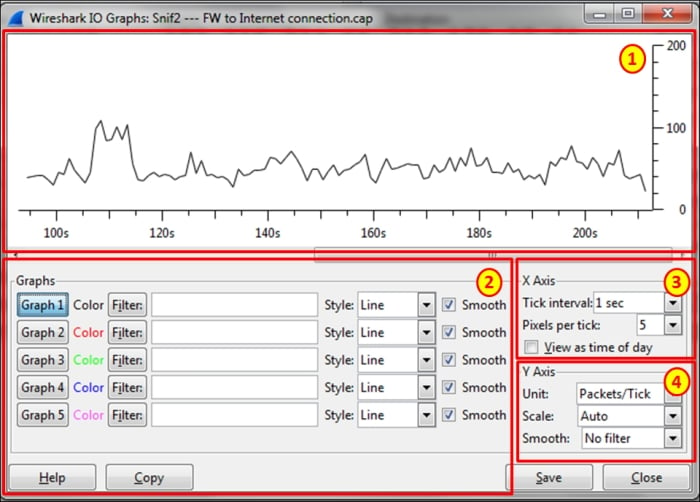
On the upper part of the window, you will get the graph highlighted as area 1. On the lower-left part, highlighted as area 2, you will get the filters that enable you to configure display filters, which will enable specific graphs. On the right-hand side of the window, highlighted as areas 3 and 4, you will get the X-Axis and Y-Axis configuration. Let's see what we can configure and how to do it.

Filter configuration

  1. In the filter window, fill in a filter in the display...

lock icon The rest of the chapter is locked
Register for a free Packt account to unlock a world of extra content!
A free Packt account unlocks extra newsletters, articles, discounted offers, and much more. Start advancing your knowledge today.
Unlock this book and the full library FREE for 7 days
Get unlimited access to 7000+ expert-authored eBooks and videos courses covering every tech area you can think of
Renews at €18.99/month. Cancel anytime