Going deeper
Logging is really helpful and can really save you a lot of time to figure out what is going on. However, sometimes, you need to go even deeper. At times, you need to look at the raw traffic. There are a few ways to do this.
Fiddler
A popular, free, and very good debugging tool to debug HTTP traffic is Fiddler. You can download it for free at http://www.telerik.com/fiddler. It gives you the opportunity to monitor all HTTP requests happening on your computer.
Fiddler sets itself as a proxy between all traffic and in order to get the best experience from it, you need to enable streams, otherwise SignalR will fall back to long-polling, but not immediately (typically, after 3-5 seconds), as shown in the following screenshot:
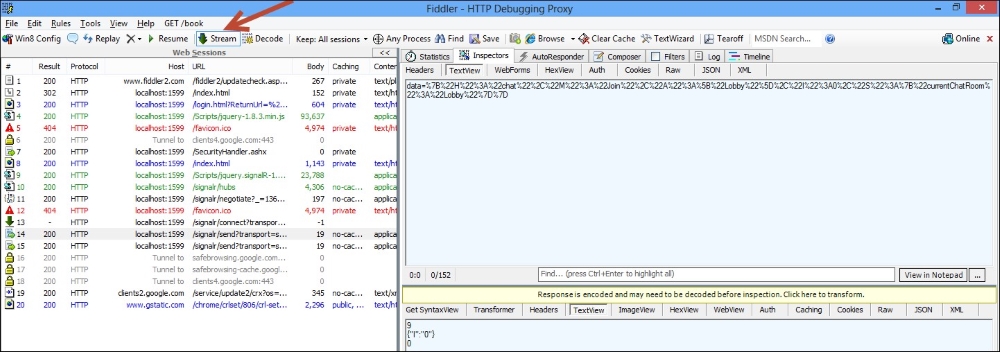
Long-polling in SignalR
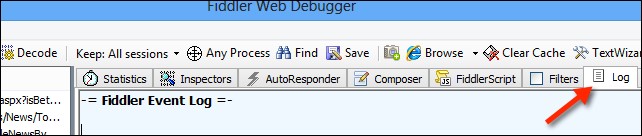
If the browser and server support web sockets, SignalR might choose to use this as its preferred transport. In this case, you want to open the Log tab, as shown here:
Performance counters
Monitor messages on a higher level to see the throughput...