Search icon CANCEL
Subscription
0
Cart icon
Your Cart (0 item)
Close icon
You have no products in your basket yet
Save more on your purchases! discount-offer-chevron-icon
Savings automatically calculated. No voucher code required.
Arrow left icon
Explore Products
Best Sellers
New Releases
Books
Videos
Audiobooks
Learning Hub
Free Learning
Arrow right icon
Arrow up icon
GO TO TOP
Learning Microsoft Azure

You're reading from   Learning Microsoft Azure A comprehensive guide to cloud application development using Microsoft Azure

Arrow left icon
Product type Paperback
Published in Oct 2014
Publisher Packt
ISBN-13 9781782173373
Length 430 pages
Edition 1st Edition
Tools
Arrow right icon
Author (1):
Arrow left icon
Geoff Webber Cross Geoff Webber Cross
Author Profile Icon Geoff Webber Cross
Geoff Webber Cross
Arrow right icon
View More author details
Toc

Table of Contents (14) Chapters Close

Preface 1. Getting Started with Microsoft Azure FREE CHAPTER 2. Designing a System for Microsoft Azure 3. Starting to Develop with Microsoft Azure 4. Creating and Managing a Windows Azure SQL Server Database 5. Building Azure MVC Websites 6. Azure Website Diagnostics and Debugging 7. Azure Service Bus Topic Integration 8. Building Worker Roles 9. Cloud Service Diagnostics, Debugging, and Configuration 10. Web API and Client Integration 11. Integrating a Mobile Application Using Mobile Services 12. Preparing an Azure System for Production Index

Exploring the topic workspace


If we navigate to our Service Bus namespace workspace in the portal and click on the TOPICS tab, we can see a quick overview of our topics, including their status, stored message size (CURRENT SIZE), and capacity (MAX SIZE):

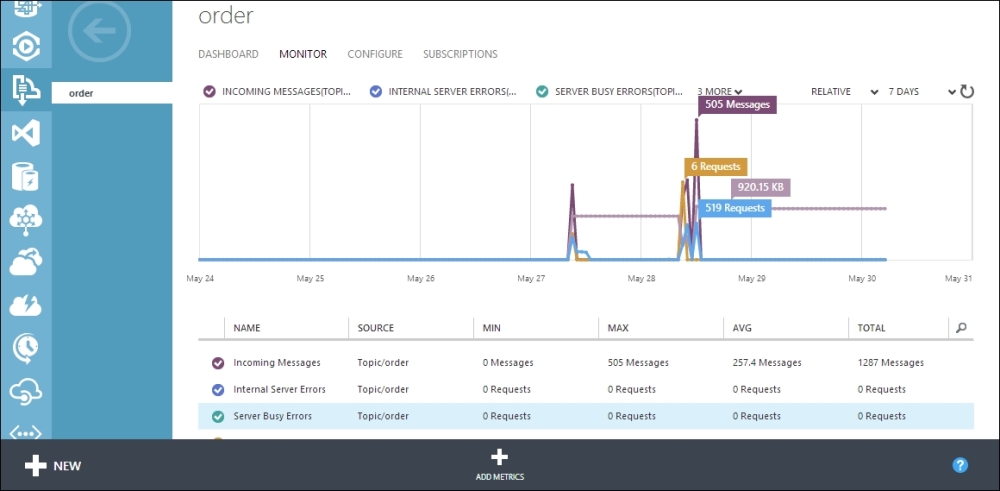
Now, if we click on the topic and navigate to its workspace, we have a DASHBOARD section, which gives us a quick overview of the topic status with a graph that shows the messaging metrics, and a usage overview, which shows us how much of our storage allowance we're using along with some quick glance information.

The MONITOR tab

The MONITOR tab shows us the same metrics graph as the DASHBOARD section with more details of the tabular statistics underneath:
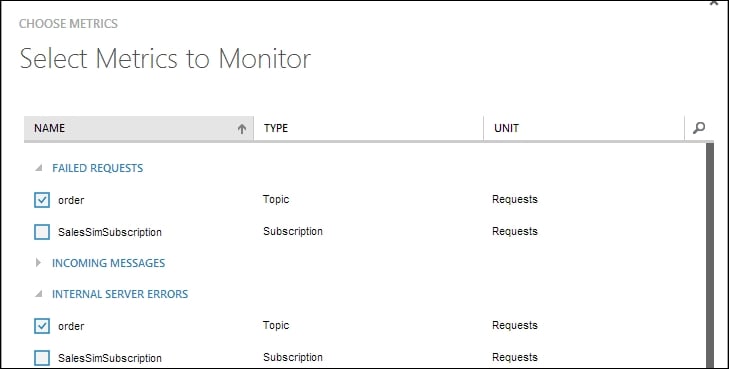
If we click on the ADD METRICS button, we can add and remove metrics from the display:
The CONFIGURE tab

The CONFIGURE tab allows us to configure the following settings that we originally set up when we created the topic:

  • DEFAULT MESSAGE TIME TO LIVE: This is the amount of time elapsed between...

lock icon The rest of the chapter is locked
Register for a free Packt account to unlock a world of extra content!
A free Packt account unlocks extra newsletters, articles, discounted offers, and much more. Start advancing your knowledge today.
Unlock this book and the full library FREE for 7 days
Get unlimited access to 7000+ expert-authored eBooks and videos courses covering every tech area you can think of
Renews at $19.99/month. Cancel anytime
Banner background image