Introduction to Market Segmentation
Market segmentation is dividing customers into different segments based on common characteristics. The following are the uses of customer segmentation:
Increasing customer conversion and retention
Developing new products for a particular segment by identifying it and its needs
Improving brand communication with a particular segment
Identifying gaps in marketing strategy and making new marketing strategies to increase sales
Exercise 4: Exploring the Wholesale Customer Dataset
In this exercise, we will have a look at the data in the wholesale customer dataset.
Note
For all the exercises and activities where we are importing an external CSV or image files, go to RStudio-> Session-> Set Working Directory-> To Source File Location. You can see in the console that the path is set automatically.
To download the CSV file, go to https://github.com/TrainingByPackt/Applied-Unsupervised-Learning-with-R/tree/master/Lesson01/Exercise04/wholesale_customers_data.csv. Click on wholesale_customers_data.csv.
Note
This dataset is taken from the UCI Machine Learning Repository. You can find the dataset at https://archive.ics.uci.edu/ml/machine-learning-databases/00292/. We have downloaded the file and saved it at https://github.com/TrainingByPackt/Applied-Unsupervised-Learning-with-R/tree/master/Lesson01/Exercise04/wholesale_customers_data.csv.
Save it to the folder in which you have installed R. Now, to load it in R, use the following function:
ws<-read.csv("wholesale_customers_data.csv")Now we may have a look at the different columns and rows in this dataset by using the following function in R:
head(ws)
The output is as follows:

Figure 1.19: Columns of the wholesale customer dataset
These six rows show the first six rows of annual spending in monetary units by category of product.
Activity 2: Customer Segmentation with k-means
For this activity, we're going to use the wholesale customer dataset from the UCI Machine Learning Repository. It's available at: https://github.com/TrainingByPackt/Applied-Unsupervised-Learning-with-R/tree/master/Lesson01/Activity02/wholesale_customers_data.csv. We're going to identify customers belonging to different market segments who like to spend on different types of goods with clustering. Try k-means clustering for values of k from 2 to 6.
Note
This dataset is taken from the UCI Machine Learning Repository. You can find the dataset at https://archive.ics.uci.edu/ml/machine-learning-databases/00292/. We have downloaded the file and saved it at https://github.com/TrainingByPackt/Applied-Unsupervised-Learning-with-R/tree/master/Lesson01/Activity02/wholesale_customers_data.csv.
These steps will help you complete the activity:
Read data downloaded from the UCI Machine Learning Repository into a variable. The data can be found at: https://github.com/TrainingByPackt/Applied-Unsupervised-Learning-with-R/tree/master/Lesson01/Activity02/wholesale_customers_data.csv.
Select only two columns, Grocery and Frozen, for easy visualization of clusters.
As in Step 2 of Exercise 4, Exploring the Wholesale Customer Dataset, change the value for the number of clusters to 2 and generate the cluster centers.
Plot the graph as in Step 4 in Exercise 4, Exploring the Wholesale Customer Dataset.
Save the graph you generate.
Repeat Steps 3, 4, and 5 by changing value for the number of clusters to 3, 4, 5, and 6.
Decide which value for the number of clusters best classifies the dataset.
The output will be chart of six clusters as follows:
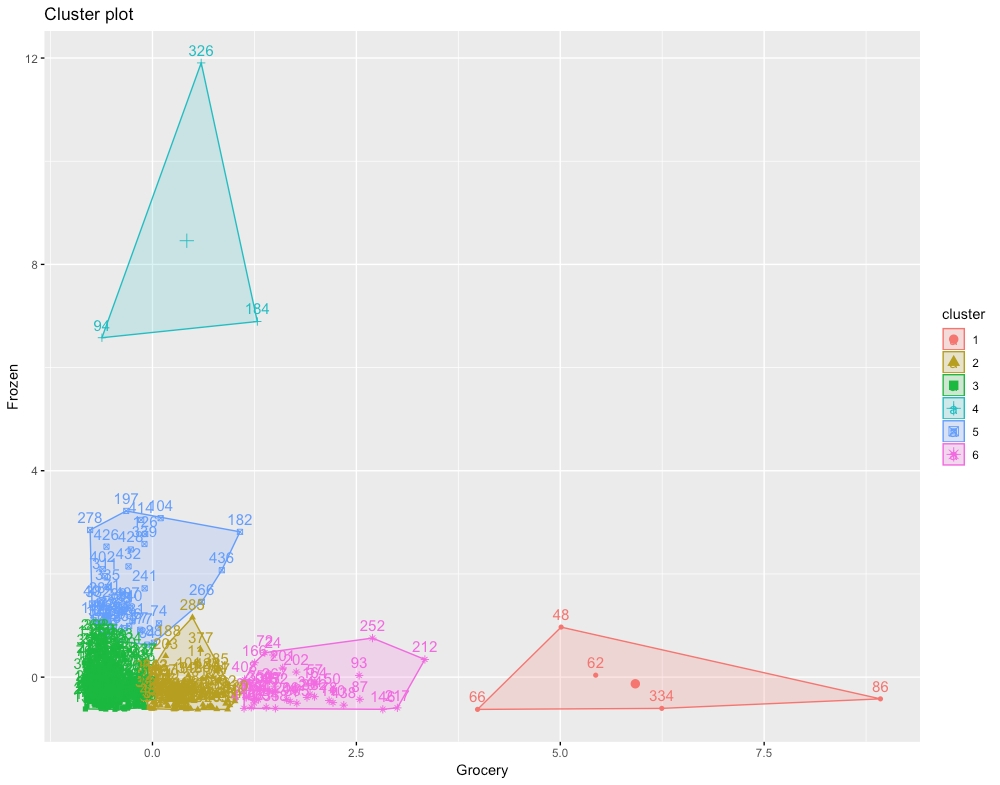
Figure 1.20: The expected chart for six clusters
Note
The solution for this activity can be found on page 201.