Search icon CANCEL
Arrow left icon
Explore Products
Best Sellers
New Releases
Books
Videos
Audiobooks
Learning Hub
Conferences
Free Learning
Arrow right icon
Arrow up icon
GO TO TOP
SharePoint Development with the SharePoint Framework

You're reading from   SharePoint Development with the SharePoint Framework Design and implement state-of-the-art customizations for SharePoint

Arrow left icon
Product type Paperback
Published in Sep 2017
Publisher Packt
ISBN-13 9781787121430
Length 386 pages
Edition 1st Edition
Languages
Concepts
Arrow right icon
Authors (2):
Arrow left icon
Jussi Roine Jussi Roine
Author Profile Icon Jussi Roine
Jussi Roine
Olli Jääskeläinen Olli Jääskeläinen
Author Profile Icon Olli Jääskeläinen
Olli Jääskeläinen
Arrow right icon
View More author details
Toc

Table of Contents (14) Chapters Close

Preface 1. Introducing SharePoint Online for Developers FREE CHAPTER 2. Developing Solutions for SharePoint 3. Getting Started with the SharePoint Framework 4. Building Your First Web Part 5. Using Visual Studio Code and Other Editors 6. Packaging and Deploying Solutions 7. Working with SharePoint Content 8. Working with the Web Part Property Pane 9. Using React and Office UI Fabric React Components 10. Working with Other JavaScript Frameworks 11. Troubleshooting and Debugging SharePoint Framework Solutions 12. SharePoint APIs and Microsoft Graph 13. The Future of SharePoint Customizations

Debugging with source maps

Source maps are a great feature that aid in debugging, especially when your source files might be minified and bundled. You can force the building of a source map for all of your client-side scripts and files, and then navigate the generated map during debugging. They also allow you to enable breakpoints on any file part of your solution without the need to go to Visual Studio Code to try and find out which file and which line you need.

The SharePoint Framework automatically generates source maps, and they are also enabled when you debug code through Visual Studio Code through a separate configuration setting.

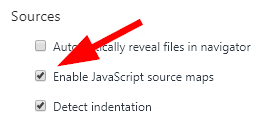
When you're running Developer Tools in Chrome, press F1 to verify that you have JavaScript source maps enabled, as follows:
While debugging in Chrome, you can now travel through the sources. This also includes webpack:// in the source tree that provides you with a fantastic way to reveal what is loaded and where:
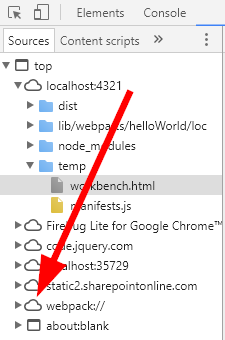
You can now travel through all the...

lock icon The rest of the chapter is locked
Register for a free Packt account to unlock a world of extra content!
A free Packt account unlocks extra newsletters, articles, discounted offers, and much more. Start advancing your knowledge today.
Unlock this book and the full library FREE for 7 days
Get unlimited access to 7000+ expert-authored eBooks and videos courses covering every tech area you can think of
Renews at $19.99/month. Cancel anytime