Search icon CANCEL
Subscription
0
Cart icon
Your Cart (0 item)
Close icon
You have no products in your basket yet
Save more on your purchases! discount-offer-chevron-icon
Savings automatically calculated. No voucher code required.
Arrow left icon
Explore Products
Best Sellers
New Releases
Books
Videos
Audiobooks
Learning Hub
Newsletter Hub
Free Learning
Arrow right icon
timer SALE ENDS IN
0 Days
:
00 Hours
:
00 Minutes
:
00 Seconds
Arrow up icon
GO TO TOP
PowerShell Troubleshooting Guide

You're reading from   PowerShell Troubleshooting Guide Minimize debugging time and maximize troubleshooting efficiency by leveraging the unique features of the PowerShell language

Arrow left icon
Product type Paperback
Published in Nov 2014
Publisher
ISBN-13 9781782173571
Length 206 pages
Edition 1st Edition
Arrow right icon
Author (1):
Arrow left icon
Michael Shepard Michael Shepard
Author Profile Icon Michael Shepard
Michael Shepard
Arrow right icon
View More author details
Toc

Table of Contents (10) Chapters Close

Preface 1. PowerShell Primer FREE CHAPTER 2. PowerShell Peculiarities 3. PowerShell Practices 4. PowerShell Professionalism 5. Proactive PowerShell 6. Preparing the Scripting Environment 7. Reactive Practices – Traditional Debugging 8. PowerShell Code Smells Index

Using Set-PSDebug


We already met the Set-PSDebug cmdlet in Chapter 5, Proactive PowerShell, where we learned that the –Strict switch can be used to ensure that references to variables that haven't been assigned will cause an error. In the context of debugging, the Set-PSDebug cmdlet gives a very simple debugging experience at the command line using the –Trace parameter and the –Step switch. Let's use a simple script to illustrate this:

foreach ($i in 1..10){
    write-host $i
}

While there should be no confusion over what this script will do when executed, watch what happens when we run Set-PSDebug –Trace 1 and then run the script:
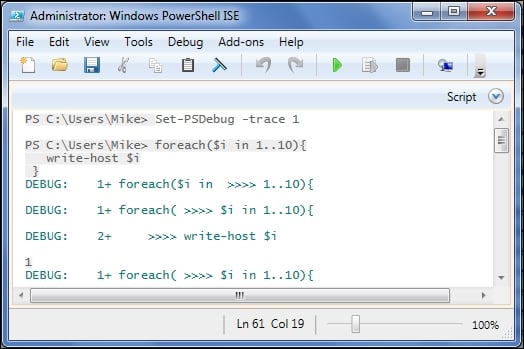
I've truncated the output, but it should be clear that the PowerShell engine is outputting debug messages (like we could with Write-Debug) for each line that is executed. The output shown is from the ISE, but the cmdlet works in the console as well, although the formatting is slightly different:
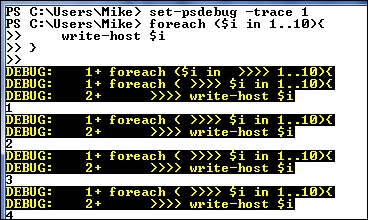
Changing the value of the trace parameter to 2 gives a more detailed...

lock icon The rest of the chapter is locked
Register for a free Packt account to unlock a world of extra content!
A free Packt account unlocks extra newsletters, articles, discounted offers, and much more. Start advancing your knowledge today.
Unlock this book and the full library FREE for 7 days
Get unlimited access to 7000+ expert-authored eBooks and videos courses covering every tech area you can think of
Renews at $19.99/month. Cancel anytime
Banner background image