Search icon CANCEL
Subscription
0
Cart icon
Cart
Close icon
You have no products in your basket yet
Save more on your purchases!
Savings automatically calculated. No voucher code required
Arrow left icon
All Products
Best Sellers
New Releases
Books
Videos
Audiobooks
Learning Hub
Newsletters
Free Learning
Arrow right icon
Arrow up icon
GO TO TOP
Pentaho 5.0 Reporting by Example: Beginner's Guide

You're reading from  Pentaho 5.0 Reporting by Example: Beginner's Guide

Product type Book
Published in Aug 2013
Publisher Packt
ISBN-13 9781782162247
Pages 342 pages
Edition 1st Edition
Languages
Author (1):
Mariano, GARCIA MATTIO Mariano, GARCIA MATTIO
Profile icon Mariano, GARCIA MATTIO
Toc

Table of Contents (23) Chapters close

Pentaho 5.0 Reporting by Example
Credits
About the Authors
About the Reviewers
www.PacktPub.com
Preface
1. What is Pentaho Report Designer? 2. Installation and Configuration 3. Start PRD and the User Interface (UI) Layout 4. Instant Gratification – Creating Your First Report with PRD 5. Adding a Relational Data Source 6. Adding Groups 7. Adding Parameters 8. Using Formulas in Our Reports 9. Adding Charts 10. Adding Subreports 11. Publishing and Running Reports in Pentaho BA Server 12. Making a Difference – Reports with Hyperlinks and Sparklines 13. Environment Variables, Stylesheets, and Crosstabs 14. PRD Reports Embedded in Web Applications Sakila DB Data Dictionary Pop Quiz Answers Index

Time for action – configuring details


Next, we will configure Details to get the following result:

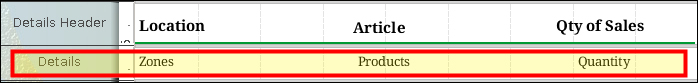
  1. We select the Data tab and drag-and-drop Zones, Products, and Quantity, placing each under the corresponding label.

    Note

    As we saw before, these objects that we just added to the report are actually the text field () and number field (). This is because PRD makes mapping the data type dragged to the work area with the required insertable object.

  2. Now we will execute the report to see the results it is giving us.

    We press the icon found in the shortcut bar. This will give us different format options to output the report.

    In this case, we choose Print Preview as follows:

  3. This will give us the following preview:

What just happened?

We added the fields Zones, Products, and Quantity to the Details section of our report. Then we executed our report in preview mode.

lock icon The rest of the chapter is locked
Register for a free Packt account to unlock a world of extra content!
A free Packt account unlocks extra newsletters, articles, discounted offers, and much more. Start advancing your knowledge today.
Unlock this book and the full library FREE for 7 days
Get unlimited access to 7000+ expert-authored eBooks and videos courses covering every tech area you can think of
Renews at $15.99/month. Cancel anytime}