Search icon CANCEL
Subscription
0
Cart icon
Your Cart (0 item)
Close icon
You have no products in your basket yet
Save more on your purchases! discount-offer-chevron-icon
Savings automatically calculated. No voucher code required.
Arrow left icon
Explore Products
Best Sellers
New Releases
Books
Videos
Audiobooks
Learning Hub
Newsletter Hub
Free Learning
Arrow right icon
timer SALE ENDS IN
0 Days
:
00 Hours
:
00 Minutes
:
00 Seconds
Arrow up icon
GO TO TOP
Data Analytics Using Splunk 9.x

You're reading from   Data Analytics Using Splunk 9.x A practical guide to implementing Splunk's features for performing data analysis at scale

Arrow left icon
Product type Paperback
Published in Jan 2023
Publisher Packt
ISBN-13 9781803249414
Length 336 pages
Edition 1st Edition
Tools
Arrow right icon
Author (1):
Arrow left icon
Dr. Nadine Shillingford Dr. Nadine Shillingford
Author Profile Icon Dr. Nadine Shillingford
Dr. Nadine Shillingford
Arrow right icon
View More author details
Toc

Table of Contents (18) Chapters Close

Preface 1. Part 1: Getting Started with Splunk
2. Chapter 1: Introduction to Splunk and its Core Components FREE CHAPTER 3. Chapter 2: Setting Up the Splunk Environment 4. Chapter 3: Onboarding and Normalizing Data 5. Part 2: Visualizing Data with Splunk
6. Chapter 4: Introduction to SPL 7. Chapter 5: Reporting Commands, Lookups, and Macros 8. Chapter 6: Creating Tables and Charts Using SPL 9. Chapter 7: Creating Dynamic Dashboards 10. Part 3: Advanced Topics in Splunk
11. Chapter 8: Licensing, Indexing, and Buckets 12. Chapter 9: Clustering and Advanced Administration 13. Chapter 10: Data Models, Acceleration, and Other Ways to Improve Performance 14. Chapter 11: Multisite Splunk Deployments and Federated Search 15. Chapter 12: Container Management 16. Index 17. Other Books You May Enjoy

Adding tables and charts to dashboards

We will start with a basic dashboard panel containing a table we created in Chapter 6, Creating Tables and Charts Using SPL. As a review, let’s complete the following steps:

  1. Run the following query in the search bar:
    index=botsv1 earliest=0 sourcetype=iis
    | table _time, c_ip, s_ip, s_port, cs_uri_stem, cs_Referer, sc_status

This query displays IIS logs in the form of a table. Figure 7.1 shows the result of running this query:
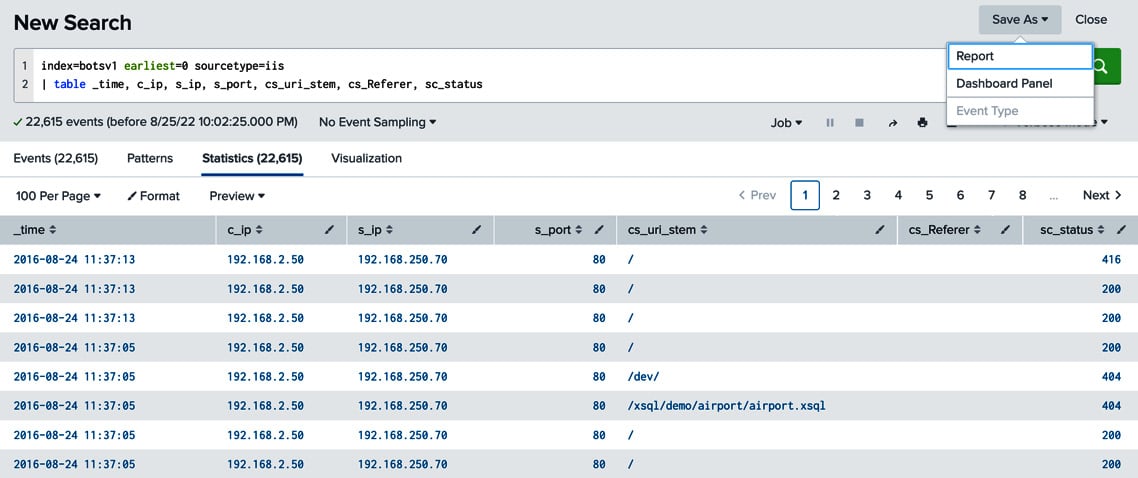
Figure 7.1 – Saving a search as a Dashboard Panel

Figure 7.1 – Saving a search as a Dashboard Panel

Notice the Save As dropdown in the top-right corner of the search bar. This dropdown allows you the save the results of the query as a single report or as a dashboard panel. A Splunk report is the saved results of a single search. A Splunk dashboard can comprise several different objects, including reports, housed in one or more panels.

  1. Let’s click on the Dashboard Panel option to save the search results...
lock icon The rest of the chapter is locked
Register for a free Packt account to unlock a world of extra content!
A free Packt account unlocks extra newsletters, articles, discounted offers, and much more. Start advancing your knowledge today.
Unlock this book and the full library FREE for 7 days
Get unlimited access to 7000+ expert-authored eBooks and videos courses covering every tech area you can think of
Renews at $19.99/month. Cancel anytime
Banner background image