


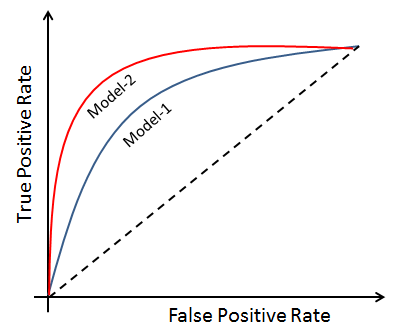
AUC-ROC curve is a tool to measure and assess the performance of classification models. ROC (Receiver Operating Characteristics) is a pictorial visualization of model performance. It plots a two-dimensional probability plot between the FP rate (or 1-specificity) and the TP rate (or sensitivity). We can also represent the area covered by a model with a single number using AUC:
Let's create the ROC curve using the scikit-learn module:
# import plot_roc_curve
from sklearn.metrics import plot_roc_curve

plot_roc_curve(logreg , feature_test, target_test)
This results in the following output:
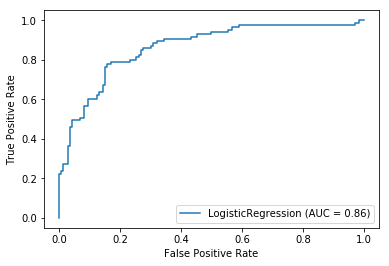
In the preceding example, We have drawn the ROC plot plot_roc_curve() method with model object, testing feature set, and testing label set parameters.
In the ROC curve, the AUC is a measure of divisibility. It tells us about the model's class distinction capability. The higher the AUC value, the better the model is at distinguishing between "fraud" and "not fraud...


