Histograms and other charts
Stata creates a lot of histograms as well. You can also create graphs by writing code instead of using Stata frontend/GUI; for example, take a look at the following:
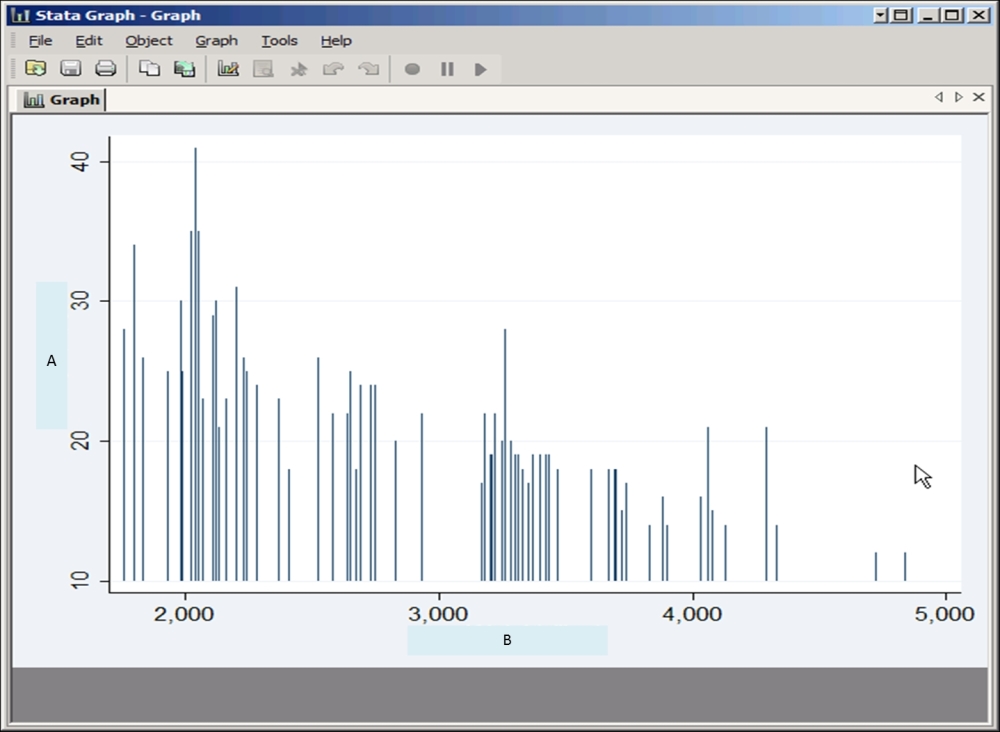
two-way bar A B
The output of this command is shown in the following figure: